Allan Gardens
Neighbourhood Park, above average overall (score 42, rank ~83th percentile). Strongest: connectivity; weakest: natural comfort.
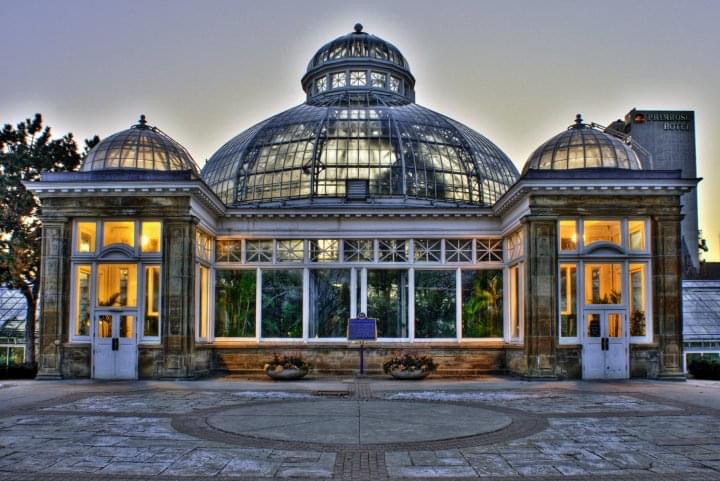
Photo by Michael M via Google Places · cached 5/9/2026
Allan Gardens scores 42.2 / 100. Strongest dimensions: enclosure / eyes on park and connectivity. Weakest: edge activation (0). Border-vacuum risk is elevated (48). This score is a transparent reading of Jane Jacobs-style vitality factors, not a definitive judgment.
Area · 5.36 ha
Weighted across six dimensions · confidence 68%
Scores are not bell-curved. Percentiles and expected scores provide context without changing the underlying model.
Loading map…
The parks map is loading.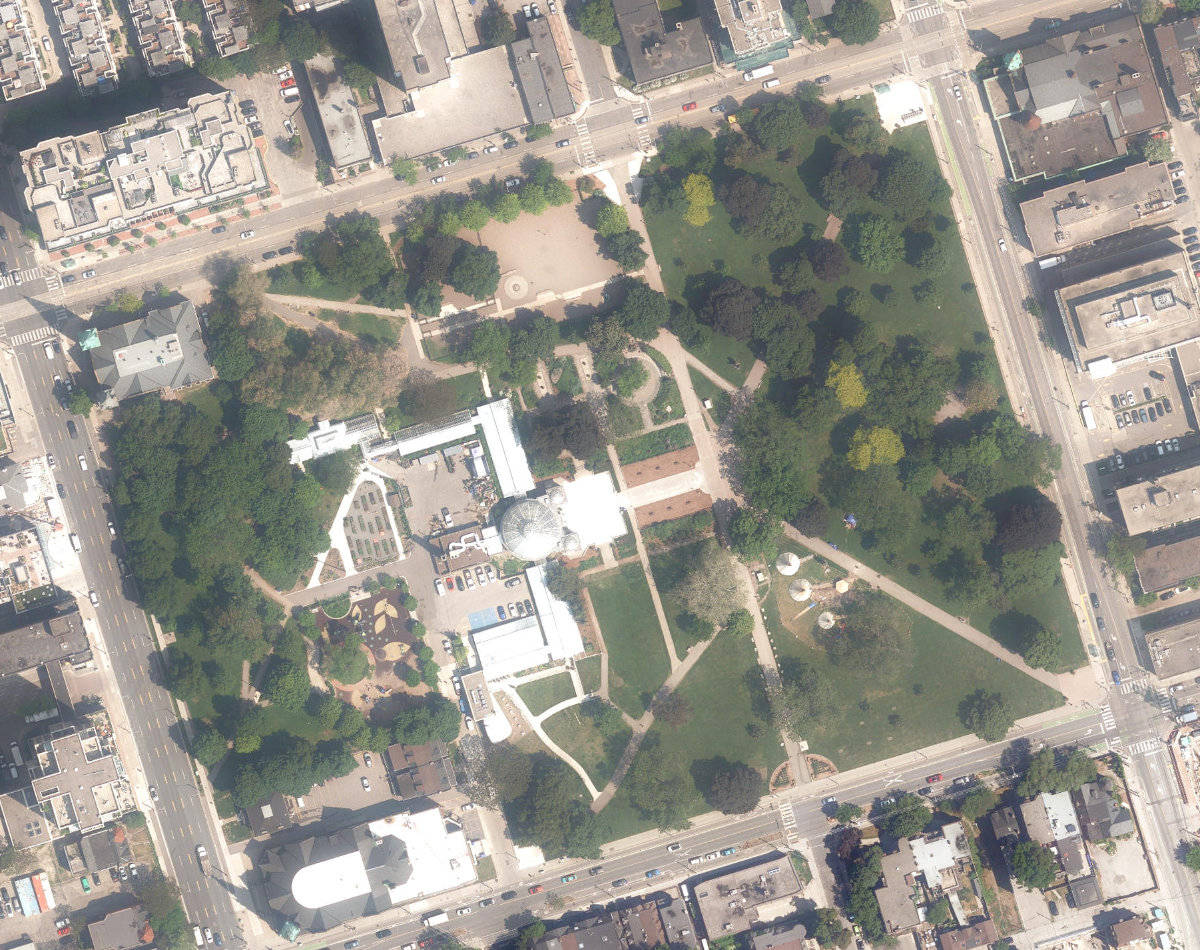
Explain this score
Where did the 42 come from? Each weighted contribution against a neutral 50 baseline. Green = pushed up; red = pulled down.
Sum of contributions = the headline score. A negative bar means that dimension dragged the park below the city-wide neutral baseline.
Why this park works
Allan Gardens works because its connectivity score (85) is one of the city's strongest and its amenity diversity (28) is also top decile (18 transit stops sit within a 400 m walk; 36 intersections fall within 100 m of the edge).
What limits this park
Allan Gardens is held back by natural comfort (37, below-average): only 0% canopy means little summer shade; border-vacuum risk is also elevated (48).
Most distinctive characteristic
Most distinctive feature: exceptionally high connectivity (85, top decile).
Jacobs reading
Allan Gardens sits between an urban social park and an ecological retreat: moderately useful for both, exceptionally suited to neither.
Tradeoffs
- Connectivity (85) significantly outpaces natural comfort (37): well placed in the city but offers little shade or ecological respite.
- The park is enclosed by buildings (86) but the surrounding streets are quiet (edge activation 0): frame without animation.
- 38 nearby towers cast wind and shadow without contributing canopy: passive surveillance is plentiful but human-scale comfort is not.
Performance in context
- A modest overperformer for its neighbourhood park typology (+8 vs the median in large Neighbourhood Park).
Typology classification
Classified as Neighbourhood Park: 5.4 ha, framed by 96 mid-rise vs 38 towers
Edge Activation
Within 100 m of the park edge: 27 active uses (restaurant, retail, community, transit_stop, cafe) and 11 dead/hostile uses (parking_lot). Active edges keep "eyes on the park" through the day; parking lots, blank institutional walls, rail and highway frontages drain street life.
Source: OSM POIs (amenity/shop) + Toronto Building Footprints + land use
Connectivity
Connectivity blends paths, intersections, transit, entrances, and edge density. This park has 80 mapped paths/walkways and 73 sidewalk segments within 50 m; 36 street intersections within 100 m; 18 transit stops within a 400 m walk; 22 estimated access points across ~1,052 m of perimeter. edge density is healthy, no superblock penalty. Source coverage: centreline, pedestrian_network, transit_osm.
Source: Toronto Centreline V2 + Pedestrian Network + OSM transit stops
Amenity Diversity
3 distinct amenity types in the park (dog_area, playground, washroom). Diversity, not raw count, drives the score so a park with many distinct activity types can outrank a larger park that repeats the same use.
Source: Toronto Parks & Recreation Facilities + OSM amenity tags
Natural Comfort
Natural-comfort components for this park: ~4.7% effective canopy (0.0% from contiguous tree polygons + scattered tree density); nearest waterbody ~1254 m; 36 city-mapped trees inside the polygon (6.7/ha). Reading: exposed. Source coverage: waterbodies, street_trees. Impervious surface is approximated (Toronto's authoritative layer ships only as a raster GeoTIFF).
Source: Toronto Treed Area + Ravine + Waterbodies + Street Tree Inventory
Enclosure / Eyes on Park
190 buildings within 25 m of the park edge (96 mid-rise, 56 low-rise, 38 tower); avg edge height 22.2 m (~7 floors); 18.1 buildings per 100 m of 1,052 m perimeter (strong frontage density); edges lean tall but still framed; 38 towers ≥ 40 m within 25 m of the edge. "Eyes on the park" come strongest from the 96 mid-rise edge buildings.
Source: Toronto 3D Massing (building footprints + heights)
Border Vacuum Risk
Border-vacuum factors within 50 m of the park: parking_lot, parking_lot, parking_lot, parking_lot. Jacobs warned that highways, rail, parking lots and blank institutional edges act as "vacuums" that suppress foot traffic and isolate the park from its neighbourhood.
Source: Toronto Street Centreline (highways) + rail layer + OSM landuse + building footprints
Equity Context
Equity Context requires inputs not yet loaded for this park (Toronto Neighbourhood Profiles). Score is held at a neutral 50 with low confidence. Read with caution.
Source: Toronto Neighbourhood Profiles
Amenities (3 types · 3 records)
- dog area
- playground
- washroom
Nearby active-edge features (56)
- parking lot0 m
- transit stop: Gerrard Street East3 m
- transit stop: Sherbourne Street10 m
- parking lot11 m
- transit stop: Carlton Street17 m
- restaurant: Kata Sushi23 m
- retail: Greendale Drugs25 m
- retail: Take A Walk On The Wildside Toronto27 m
- transit stop: Sherbourne Street27 m
- retail: Little Bee Supermarket28 m
- community: Miziwe Biik Aboriginal Employment and Training30 m
- retail30 m
- transit stop: Gerrard Street East32 m
- retail: KC's Convenience35 m
- retail: Kwik Kopy35 m
- transit stop: Carlton Street37 m
- parking lot37 m
- cafe: Tim Hortons39 m
- retail: Adina Photo40 m
- retail40 m
- transit stop: Jarvis Street42 m
- parking lot46 m
- transit stop: Jarvis Street49 m
- parking lot54 m
- parking lot55 m
- parking lot58 m
- restaurant: Madras Curry59 m
- retail: Vertie64 m
- parking lot66 m
- retail: J & S Convenience75 m
- restaurant: Chew Chew's Diner80 m
- restaurant: Golden Diner Family Restaurant84 m
- retail: Jarvis Market88 m
- parking lot88 m
- retail: Local Central Shop90 m
- parking lot92 m
- parking lot93 m
- retail: Fix-It Friend94 m
- cafe: Jarvis house bed and breakfast103 m
- parking lot108 m
- parking lot109 m
- restaurant: Pita Land111 m
- retail119 m
- retail: MMT Downtown Pharmacy & Clinic121 m
- retail: Blvck Lvbel Tattoo127 m
- restaurant: Fat Bastard Burrito127 m
- retail133 m
- parking lot159 m
- restaurant: Bocconcini Pizza and Wings162 m
- parking lot165 m
- parking lot167 m
- parking lot: Sherbourne170 m
- cafe: 18 Feet173 m
- parking lot174 m
- parking lot177 m
- retail: Rabba184 m
Park profile
Five-axis radar across the structural dimensions.
Citywide percentile ranks
Across all Toronto parks in the dataset.
- Overall vitality83th
- Edge activation32th
- Connectivity100th
- Amenity diversity93th
- Natural comfort30th
- Enclosure92th
Most similar parks
Closest in metric space across the five structural dimensions.
- Willowdale ParkCorridor / Linear Park38
- Jean Sibelius SquareCivic Square46
- Warden Hilltop Community CentreParkette44
- Sorauren Avenue ParkAthletic / Recreation Park45
- Woodbine ParkWaterfront Park37
Most opposite parks
Furthest in metric space. Useful for recognising what kind of park this isn’t.
- Trca Lands ( 26)Ravine / Naturalized Park27
- Toronto Islands - Muggs Island ParkRavine / Naturalized Park25
- Rouge ParkRavine / Naturalized Park28
- Rouge ParkRavine / Naturalized Park26
- Rouge ParkWaterfront Park25
Visitor signals
Public attention measured by Google Places aggregates. This proxies attention, not occupancy. Aggregate-only: no usernames, no review text, no extra photos beyond the cached hero.
“Collection of plants from around the world housed in a cast-iron & glass building dating from 1910.” (Google editorial summary)
p99 citywide · p99 within Neighbourhood Park
Source: Google Places API · match high (0.99 composite confidence) · last refreshed 5/9/2026. Privacy contract. Measures public attention, not occupancy.
Human activity signals
Programming, social attention, temporal rhythm, and nearby pedestrian / cycling flow. An experimental aggregate layer that complements the spatial scores. Partial coverage, partial confidence.
Activity reading: 18 events/yr (6 recurring); 1,100 public mentions; pedestrian intensity 65/100; cycling/trail 50/100. The strongest signal is observed pedestrian/cycling activity. These are illustrative sample values. Calibrate before citing.
Sample data: numbers shown here are an illustrative fixture for the 10 named parks, not a measurement.
Does this score feel accurate?
Your read of Allan Gardensmatters. We’re testing whether the model lines up with how people actually use the park. Submissions are stored locally; no account needed.
Tell us how this park feels
We measure structure (canopy, edges, connectivity). You measure feeling. Both matter, and disagreement is itself useful civic data.
What would improve this park?
Generated from the weakest measured dimensions: a starting point, not a prescription.
- Activate the edges: encourage cafés, retail or community uses on the streets that face the park; replace blank or parking-lot edges where possible.
- Diversify what people can do in the park (playground, washroom, water, shade, performance, sport, garden): even small additions raise this score.
- Increase canopy and reduce paved area. Shade and water features extend usable hours and seasons.
- Mitigate border vacuums (highways, rail, parking) with active programming on the still-permeable edges and treat the hostile edge as a design challenge.
Data sources
- City of Toronto Open Data: Parks (Green Space)Polygon boundaries, official names, types.
- Parks & Recreation FacilitiesInventory of in-park amenities (washrooms, fields, rinks…).
- Toronto Pedestrian NetworkSidewalk segments around and through parks; estimated park entrances.
- Toronto Centreline V2Street segments + intersection nodes near park edges; trails and walkways.
- Toronto 3D MassingBuilding footprints + heights for edge-building counts, frontage density, and tower-in-the-park risk.
- Toronto Treed AreaTree canopy share inside park polygons via stratified-grid sampling.
- Toronto Waterbodies & RiversWater surface inside parks + nearest-water distance for cooling.
- Ravine & Natural Feature ProtectionRavine overlap as a cooling / natural-comfort signal.
- Toronto Street Tree InventoryTree count + density inside park polygons.
- Neighbourhood Profiles(Pending) Equity context proxy.
- OpenStreetMap (Overpass API)Cafés, restaurants, retail, transit stops, parking, highways, rail.