Bennett Park
Urban Plaza, above average overall (score 41, rank ~80th percentile). Strongest: enclosure; weakest: natural comfort.
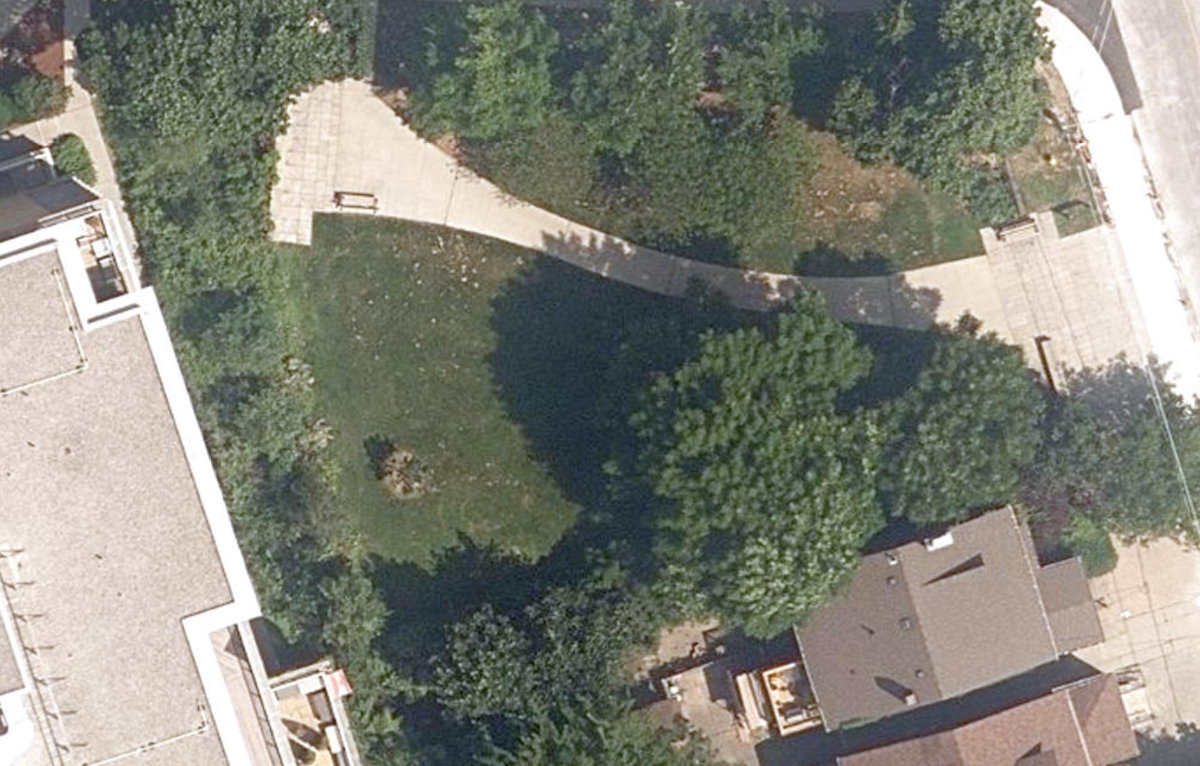
Aerial, City of Toronto orthophoto, ~8 cm/px source · cached 5/9/2026
Bennett Park scores 41.1 / 100. Strongest dimensions: enclosure / eyes on park and connectivity. Weakest: amenity diversity (0). Border-vacuum risk is elevated (36). This score is a transparent reading of Jane Jacobs-style vitality factors, not a definitive judgment.
Area · 0.09 ha
Weighted across six dimensions · confidence 57%
Scores are not bell-curved. Percentiles and expected scores provide context without changing the underlying model.
Loading map…
The parks map is loading.Explain this score
Where did the 41 come from? Each weighted contribution against a neutral 50 baseline. Green = pushed up; red = pulled down.
Sum of contributions = the headline score. A negative bar means that dimension dragged the park below the city-wide neutral baseline.
Why this park works
Bennett Park works because its enclosure score (92) is one of the city's strongest and its edge activation (36) is also top decile (40 mid-rise buildings frame the edge with passive surveillance).
What limits this park
Bennett Park's edges are fronted by border-vacuum land uses (highways, rail, parking, blank institutional), risk score 36.
Most distinctive characteristic
Most distinctive feature: exceptionally high enclosure (92, top decile).
Jacobs reading
Bennett Park sits between an urban social park and an ecological retreat: moderately useful for both, exceptionally suited to neither.
Tradeoffs
- 7 nearby towers cast wind and shadow without contributing canopy: passive surveillance is plentiful but human-scale comfort is not.
Typology classification
Classified as Urban Plaza: 924 m², paved (0% canopy), 53.2 buildings/100 m
Edge Activation
Within 100 m of the park edge: 13 active uses (transit_stop, restaurant, retail, cafe) and 4 dead/hostile uses (rail, highway, parking_lot). Active edges keep "eyes on the park" through the day; parking lots, blank institutional walls, rail and highway frontages drain street life.
Source: OSM POIs (amenity/shop) + Toronto Building Footprints + land use
Connectivity
Connectivity blends paths, intersections, transit, entrances, and edge density. This park has 1 mapped paths/walkways and 4 sidewalk segments within 50 m; 6 street intersections within 100 m; 18 transit stops within a 400 m walk; 1 estimated access points across ~128 m of perimeter. edge density is healthy, no superblock penalty. Source coverage: centreline, pedestrian_network, transit_osm.
Source: Toronto Centreline V2 + Pedestrian Network + OSM transit stops
Amenity Diversity
No amenities recorded. Score is 0 until inventory is loaded.
Source: Toronto Parks & Recreation Facilities + OSM amenity tags
Natural Comfort
Natural-comfort components for this park: ~4.2% effective canopy (0.0% from contiguous tree polygons + scattered tree density); nearest waterbody ~245 m; 6 city-mapped trees inside the polygon (6.0/ha). Reading: exposed. Source coverage: waterbodies, street_trees. Impervious surface is approximated (Toronto's authoritative layer ships only as a raster GeoTIFF).
Source: Toronto Treed Area + Ravine + Waterbodies + Street Tree Inventory
Enclosure / Eyes on Park
68 buildings within 25 m of the park edge (40 mid-rise, 21 low-rise, 7 tower); avg edge height 22.4 m (~7 floors); 53.2 buildings per 100 m of 128 m perimeter (strong frontage density); edges lean tall but still framed; 7 towers ≥ 40 m within 25 m of the edge. "Eyes on the park" come strongest from the 40 mid-rise edge buildings.
Source: Toronto 3D Massing (building footprints + heights)
Border Vacuum Risk
Border-vacuum factors within 50 m of the park: Bloor-Danforth Line, Bloor-Danforth Line. Jacobs warned that highways, rail, parking lots and blank institutional edges act as "vacuums" that suppress foot traffic and isolate the park from its neighbourhood.
Source: Toronto Street Centreline (highways) + rail layer + OSM landuse + building footprints
Equity Context
Equity Context requires inputs not yet loaded for this park (Toronto Neighbourhood Profiles). Score is held at a neutral 50 with low confidence. Read with caution.
Source: Toronto Neighbourhood Profiles
Amenities (0)
No amenities recorded for this park.
Nearby active-edge features (28)
- rail: Bloor-Danforth Line0 m
- rail: Bloor-Danforth Line0 m
- transit stop: High Park24 m
- transit stop: High Park24 m
- transit stop: Quebec Avenue25 m
- cafe: Lafayette Cafe47 m
- retail: Garden Foods50 m
- transit stop: High Park Avenue51 m
- transit stop57 m
- highway: Bloor Street West61 m
- parking lot69 m
- transit stop73 m
- transit stop: High Park Station79 m
- restaurant: 360 Cooking Studio90 m
- restaurant: Usagi Sushi93 m
- transit stop: High Park Station99 m
- transit stop: Parkview Gardens North100 m
- transit stop: Parkview Gardens South100 m
- highway: Bloor Street West114 m
- parking lot132 m
- highway: Bloor Street West140 m
- rail: Bloor-Danforth Line149 m
- rail: Bloor-Danforth Line149 m
- highway: Bloor Street West156 m
- parking lot161 m
- transit stop171 m
- highway: Bloor Street West177 m
- retail: Throw Me A Bone178 m
Park profile
Five-axis radar across the structural dimensions.
Citywide percentile ranks
Across all Toronto parks in the dataset.
- Overall vitality80th
- Edge activation90th
- Connectivity60th
- Amenity diversity42th
- Natural comfort36th
- Enclosure97th
Most similar parks
Closest in metric space across the five structural dimensions.
- St. Clements - Yonge ParketteUrban Plaza39
- Douglas GreenbeltWaterfront Park42
- Robert St PlaygroundUrban Plaza43
- Santa Chiara ParketteUrban Plaza40
- Seaton ParkUrban Plaza45
Most opposite parks
Furthest in metric space. Useful for recognising what kind of park this isn’t.
- Toronto Islands - Muggs Island ParkRavine / Naturalized Park25
- Trca Lands ( 26)Ravine / Naturalized Park27
- Rouge ParkWaterfront Park25
- Rouge ParkRavine / Naturalized Park28
- Rouge ParkRavine / Naturalized Park26
Human activity signals: not available
No activity signals have landed for this park yet. The model has scored its physical form but it can’t yet say how often it’s programmed, photographed, or walked through. See /data-ethics for what we will and will not collect.
Does this score feel accurate?
Your read of Bennett Parkmatters. We’re testing whether the model lines up with how people actually use the park. Submissions are stored locally; no account needed.
Tell us how this park feels
We measure structure (canopy, edges, connectivity). You measure feeling. Both matter, and disagreement is itself useful civic data.
What would improve this park?
Generated from the weakest measured dimensions: a starting point, not a prescription.
- Activate the edges: encourage cafés, retail or community uses on the streets that face the park; replace blank or parking-lot edges where possible.
- Diversify what people can do in the park (playground, washroom, water, shade, performance, sport, garden): even small additions raise this score.
- Increase canopy and reduce paved area. Shade and water features extend usable hours and seasons.
- Mitigate border vacuums (highways, rail, parking) with active programming on the still-permeable edges and treat the hostile edge as a design challenge.
Data sources
- City of Toronto Open Data: Parks (Green Space)Polygon boundaries, official names, types.
- Parks & Recreation FacilitiesInventory of in-park amenities (washrooms, fields, rinks…).
- Toronto Pedestrian NetworkSidewalk segments around and through parks; estimated park entrances.
- Toronto Centreline V2Street segments + intersection nodes near park edges; trails and walkways.
- Toronto 3D MassingBuilding footprints + heights for edge-building counts, frontage density, and tower-in-the-park risk.
- Toronto Treed AreaTree canopy share inside park polygons via stratified-grid sampling.
- Toronto Waterbodies & RiversWater surface inside parks + nearest-water distance for cooling.
- Ravine & Natural Feature ProtectionRavine overlap as a cooling / natural-comfort signal.
- Toronto Street Tree InventoryTree count + density inside park polygons.
- Neighbourhood Profiles(Pending) Equity context proxy.
- OpenStreetMap (Overpass API)Cafés, restaurants, retail, transit stops, parking, highways, rail.