Marie Baldwin Park
Corridor / Linear Park, one of the city's strongest overall (score 53, rank ~97th percentile). Strongest: edge activation; weakest: natural comfort.
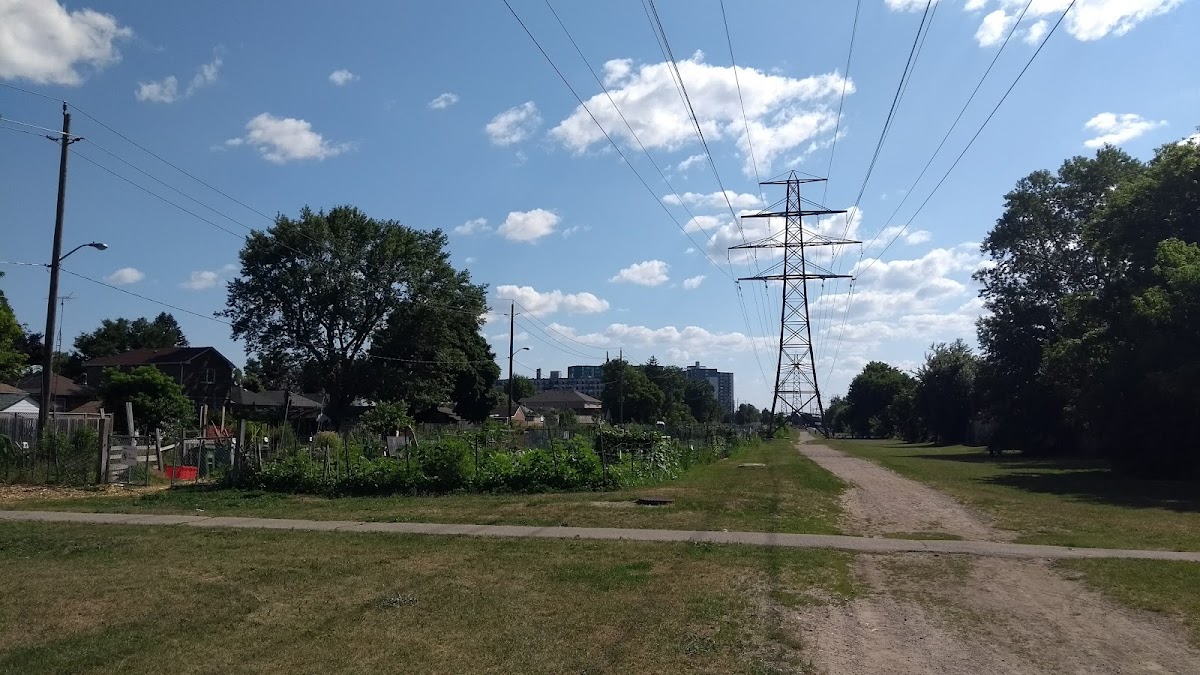
Photo by Gael Dávila López via Google Places · cached 5/9/2026
Marie Baldwin Park scores 52.5 / 100. Strongest dimensions: connectivity and enclosure / eyes on park. Weakest: amenity diversity (0). Border-vacuum risk is low. This score is a transparent reading of Jane Jacobs-style vitality factors, not a definitive judgment.
Area · 3.82 ha
Weighted across six dimensions · confidence 63%
Scores are not bell-curved. Percentiles and expected scores provide context without changing the underlying model.
Loading map…
The parks map is loading.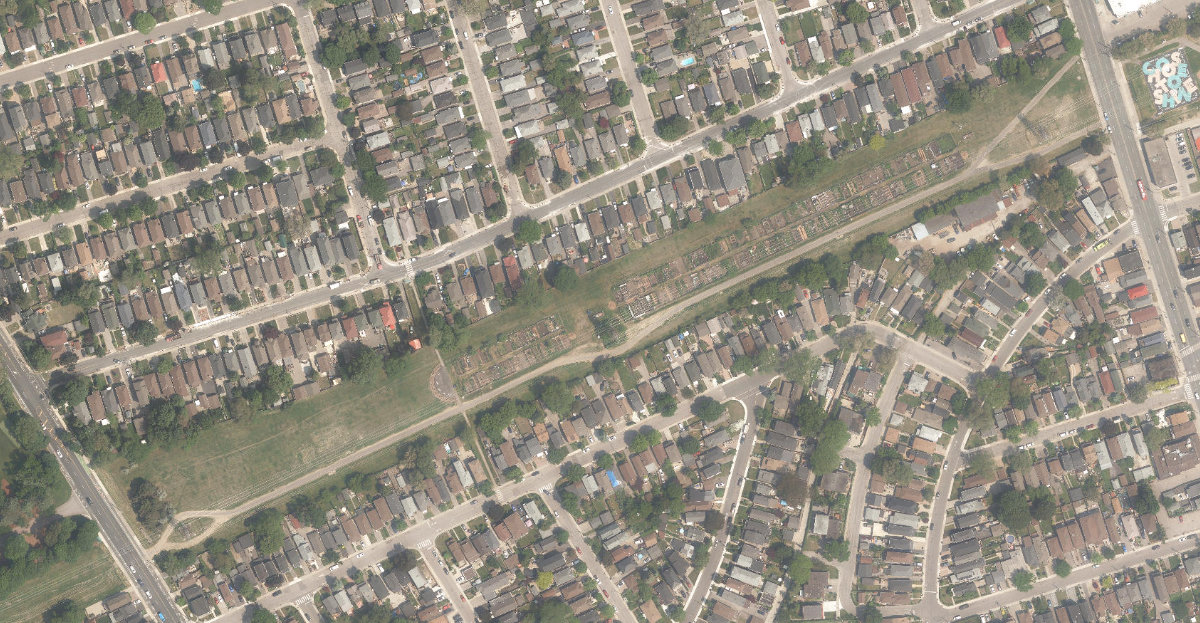
Explain this score
Where did the 53 come from? Each weighted contribution against a neutral 50 baseline. Green = pushed up; red = pulled down.
Sum of contributions = the headline score. A negative bar means that dimension dragged the park below the city-wide neutral baseline.
Why this park works
Marie Baldwin Park works because its edge activation score (60) is one of the city's strongest and its connectivity (77) is also top decile (its perimeter is lined with active uses).
What limits this park
Marie Baldwin Park is held back by natural comfort (39, below-average): only 1% canopy means little summer shade.
Most distinctive characteristic
Most distinctive feature: exceptionally high edge activation (60, top decile).
Jacobs reading
Marie Baldwin Park sits between an urban social park and an ecological retreat: moderately useful for both, exceptionally suited to neither.
Tradeoffs
- Connectivity (77) significantly outpaces natural comfort (39): well placed in the city but offers little shade or ecological respite.
Performance in context
- This park is a strong overperformer for its cohort: raw 53 versus an expected 37 for similar parks (medium Corridor / Linear Park) (gap +16).
Typology classification
Classified as Corridor / Linear Park: shape elongation 2.2× a circle of equal area. Secondary read: Neighbourhood Park (3.8 ha, framed by 1 mid-rise vs 0 towers).
Edge Activation
Within 100 m of the park edge: 19 active uses (transit_stop, restaurant, retail) and 2 dead/hostile uses (parking_lot). Active edges keep "eyes on the park" through the day; parking lots, blank institutional walls, rail and highway frontages drain street life.
Source: OSM POIs (amenity/shop) + Toronto Building Footprints + land use
Connectivity
Connectivity blends paths, intersections, transit, entrances, and edge density. This park has 4 mapped paths/walkways and 53 sidewalk segments within 50 m; 26 street intersections within 100 m; 31 transit stops within a 400 m walk; 7 estimated access points across ~1,540 m of perimeter. edge density is healthy, no superblock penalty. Source coverage: centreline, pedestrian_network, transit_osm.
Source: Toronto Centreline V2 + Pedestrian Network + OSM transit stops
Amenity Diversity
No amenities recorded. Score is 0 until inventory is loaded.
Source: Toronto Parks & Recreation Facilities + OSM amenity tags
Natural Comfort
Natural-comfort components for this park: ~3.3% effective canopy (1.3% from contiguous tree polygons + scattered tree density); nearest waterbody ~503 m; 18 city-mapped trees inside the polygon (4.7/ha). Reading: exposed. Source coverage: treed_area, waterbodies, street_trees. Impervious surface is approximated (Toronto's authoritative layer ships only as a raster GeoTIFF).
Source: Toronto Treed Area + Ravine + Waterbodies + Street Tree Inventory
Enclosure / Eyes on Park
353 buildings within 25 m of the park edge (1 mid-rise, 352 low-rise, 0 tower); avg edge height 4.8 m (~2 floors); 22.9 buildings per 100 m of 1,540 m perimeter (strong frontage density); edges are barely there or single-storey; no towers immediately adjacent. "Eyes on the park" come strongest from the 1 mid-rise edge buildings.
Source: Toronto 3D Massing (building footprints + heights)
Border Vacuum Risk
Park edges face the city. No significant border vacuum detected.
Source: Toronto Street Centreline (highways) + rail layer + OSM landuse + building footprints
Equity Context
Equity Context requires inputs not yet loaded for this park (Toronto Neighbourhood Profiles). Score is held at a neutral 50 with low confidence. Read with caution.
Source: Toronto Neighbourhood Profiles
Amenities (0)
No amenities recorded for this park.
Nearby active-edge features (33)
- transit stop16 m
- transit stop: Foxwell St at Bruton Rd20 m
- transit stop: Scarlett Rd at Foxwell St23 m
- retail: Diaper & Gift Outlet23 m
- transit stop31 m
- transit stop: Woolner Avenue36 m
- retail: VN Nails Spare37 m
- retail: Express Coin Laundry38 m
- transit stop: Foxwell St at Jane St39 m
- restaurant: 241 Pizza39 m
- retail: Vape Culture by 24x7 Vapes41 m
- parking lot51 m
- transit stop: Foxwell St at Jane St51 m
- transit stop: Foxwell St at Scarlett Rd51 m
- transit stop: Scarlett Rd at Eileen Ave53 m
- transit stop54 m
- transit stop: Foxwell Street56 m
- transit stop: Foxwell St at Scarlett Rd63 m
- retail: Wonderfood68 m
- parking lot76 m
- restaurant: Yummy Yummy96 m
- retail: Lee's Printing108 m
- retail: BSC Moto Motorcycle109 m
- transit stop: Pritchard Avenue132 m
- retail: S and A Variety Store137 m
- parking lot140 m
- transit stop: Pritchard Ave at Jane St143 m
- parking lot146 m
- restaurant146 m
- transit stop: Pritchard Avenue154 m
- transit stop: Pritchard Ave at Jane St158 m
- transit stop172 m
- transit stop197 m
Park profile
Five-axis radar across the structural dimensions.
Citywide percentile ranks
Across all Toronto parks in the dataset.
- Overall vitality97th
- Edge activation98th
- Connectivity97th
- Amenity diversity42th
- Natural comfort34th
- Enclosure50th
Most similar parks
Closest in metric space across the five structural dimensions.
- Gibson ParkCivic Square50
- Scarborough Hydro Green SpaceCorridor / Linear Park49
- Queens Quay Traffic IslandWaterfront Park46
- Liberty Village ParkCivic Square55
- Nathan Phillips SquareCivic Square42
Most opposite parks
Furthest in metric space. Useful for recognising what kind of park this isn’t.
- Trca Lands ( 26)Ravine / Naturalized Park27
- Toronto Islands - Muggs Island ParkRavine / Naturalized Park25
- Rouge ParkRavine / Naturalized Park26
- Rouge ParkRavine / Naturalized Park28
- Rouge ParkWaterfront Park25
Visitor signals
Public attention measured by Google Places aggregates. This proxies attention, not occupancy. Aggregate-only: no usernames, no review text, no extra photos beyond the cached hero.
p21 citywide · p32 within Corridor / Linear Park
Source: Google Places API · match unverified (0.00 composite confidence) · last refreshed 5/9/2026. Privacy contract. Measures public attention, not occupancy.
Human activity signals: not available
No activity signals have landed for this park yet. The model has scored its physical form but it can’t yet say how often it’s programmed, photographed, or walked through. See /data-ethics for what we will and will not collect.
Does this score feel accurate?
Your read of Marie Baldwin Parkmatters. We’re testing whether the model lines up with how people actually use the park. Submissions are stored locally; no account needed.
Tell us how this park feels
We measure structure (canopy, edges, connectivity). You measure feeling. Both matter, and disagreement is itself useful civic data.
What would improve this park?
Generated from the weakest measured dimensions: a starting point, not a prescription.
- Diversify what people can do in the park (playground, washroom, water, shade, performance, sport, garden): even small additions raise this score.
- Increase canopy and reduce paved area. Shade and water features extend usable hours and seasons.
Data sources
- City of Toronto Open Data: Parks (Green Space)Polygon boundaries, official names, types.
- Parks & Recreation FacilitiesInventory of in-park amenities (washrooms, fields, rinks…).
- Toronto Pedestrian NetworkSidewalk segments around and through parks; estimated park entrances.
- Toronto Centreline V2Street segments + intersection nodes near park edges; trails and walkways.
- Toronto 3D MassingBuilding footprints + heights for edge-building counts, frontage density, and tower-in-the-park risk.
- Toronto Treed AreaTree canopy share inside park polygons via stratified-grid sampling.
- Toronto Waterbodies & RiversWater surface inside parks + nearest-water distance for cooling.
- Ravine & Natural Feature ProtectionRavine overlap as a cooling / natural-comfort signal.
- Toronto Street Tree InventoryTree count + density inside park polygons.
- Neighbourhood Profiles(Pending) Equity context proxy.
- OpenStreetMap (Overpass API)Cafés, restaurants, retail, transit stops, parking, highways, rail.