Beaumonde Heights Park
Waterfront Park, one of the city's strongest overall (score 51, rank ~96th percentile). Strongest: amenity diversity; weakest: enclosure.
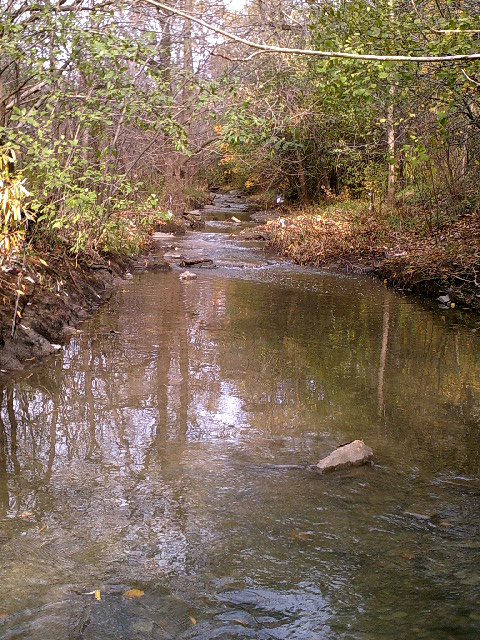
Photo by E. Victor C. via Google Places · cached 5/9/2026
Beaumonde Heights Park scores 50.8 / 100. Strongest dimensions: natural comfort and connectivity. Weakest: edge activation (16). Border-vacuum risk is low. This score is a transparent reading of Jane Jacobs-style vitality factors, not a definitive judgment.
Area · 5.14 ha
Weighted across six dimensions · confidence 72%
Scores are not bell-curved. Percentiles and expected scores provide context without changing the underlying model.
Loading map…
The parks map is loading.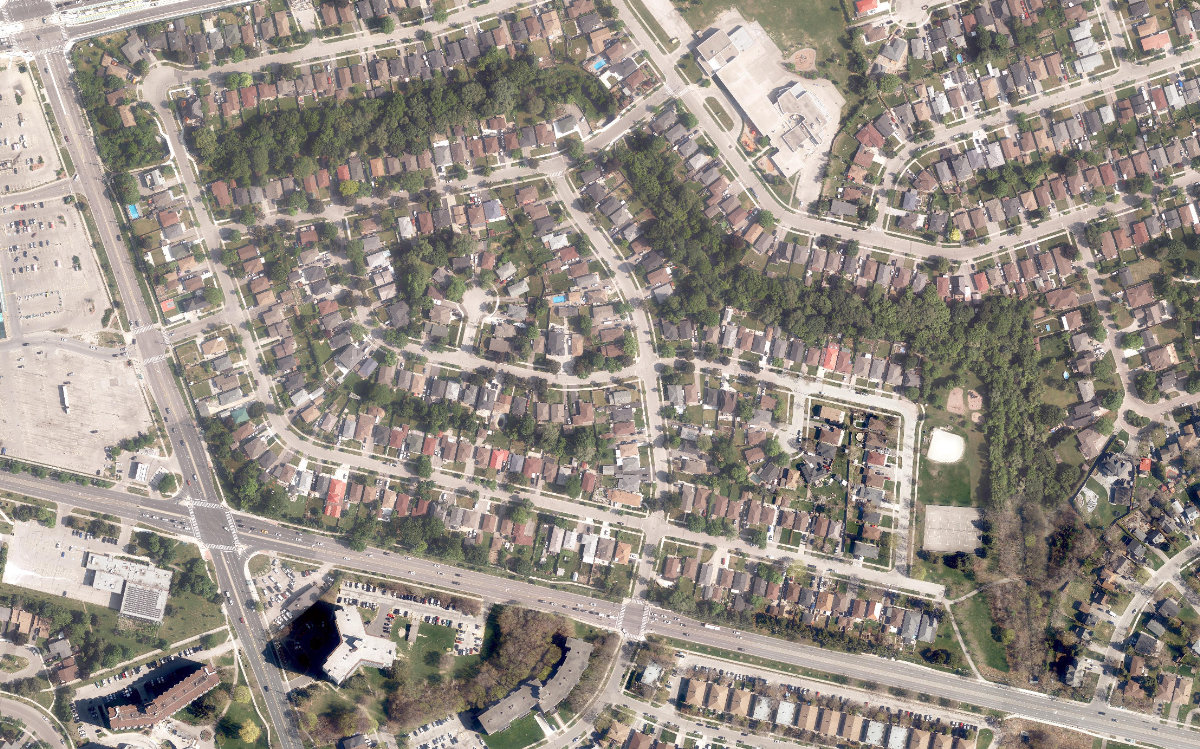
Explain this score
Where did the 51 come from? Each weighted contribution against a neutral 50 baseline. Green = pushed up; red = pulled down.
Sum of contributions = the headline score. A negative bar means that dimension dragged the park below the city-wide neutral baseline.
Why this park works
Beaumonde Heights Park works because its amenity diversity score (28) is in the top tier and its connectivity (70) is also top decile.
What limits this park
Beaumonde Heights Park is held back by enclosure (58, below-average): no mid-rise frontage to provide eyes on the park.
Most distinctive characteristic
Most distinctive feature: exceptionally high amenity diversity (28, top decile).
Jacobs reading
Beaumonde Heights Park sits between an urban social park and an ecological retreat: moderately useful for both, exceptionally suited to neither.
Performance in context
- This park is a strong overperformer for its cohort: raw 51 versus an expected 37 for similar parks (large Waterfront Park waterfront) (gap +14).
Typology classification
Classified as Waterfront Park: 7% water surface inside park. Secondary read: Ravine / Naturalized Park (95% ravine overlap, 39% canopy).
Edge Activation
Within 100 m of the park edge: 4 active uses (transit_stop) and 3 dead/hostile uses (parking_lot). Active edges keep "eyes on the park" through the day; parking lots, blank institutional walls, rail and highway frontages drain street life.
Source: OSM POIs (amenity/shop) + Toronto Building Footprints + land use
Connectivity
Connectivity blends paths, intersections, transit, entrances, and edge density. This park has 4 mapped paths/walkways and 36 sidewalk segments within 50 m; 25 street intersections within 100 m; 26 transit stops within a 400 m walk; 5 estimated access points across ~2,425 m of perimeter. moderate edge density, small superblock penalty applied. Source coverage: centreline, pedestrian_network, transit_osm.
Source: Toronto Centreline V2 + Pedestrian Network + OSM transit stops
Amenity Diversity
3 distinct amenity types in the park (playground, sports_field, tennis). Diversity, not raw count, drives the score so a park with many distinct activity types can outrank a larger park that repeats the same use.
Source: Toronto Parks & Recreation Facilities + OSM amenity tags
Natural Comfort
Natural-comfort components for this park: 38.6% estimated tree canopy; 94.7% inside the ravine system; 7.0% water surface; 43 city-mapped trees inside the polygon (8.4/ha). Reading: ravine-cooled. Source coverage: treed_area, ravine, waterbodies, street_trees. Impervious surface is approximated (Toronto's authoritative layer ships only as a raster GeoTIFF).
Source: Toronto Treed Area + Ravine + Waterbodies + Street Tree Inventory
Enclosure / Eyes on Park
258 buildings within 25 m of the park edge (0 mid-rise, 258 low-rise, 0 tower); avg edge height 4.0 m (~1 floors); 10.6 buildings per 100 m of 2,425 m perimeter (strong frontage density); edges are barely there or single-storey; no towers immediately adjacent. "Eyes on the park" come strongest from the 0 mid-rise edge buildings.
Source: Toronto 3D Massing (building footprints + heights)
Border Vacuum Risk
Park edges face the city. No significant border vacuum detected.
Source: Toronto Street Centreline (highways) + rail layer + OSM landuse + building footprints
Equity Context
Equity Context requires inputs not yet loaded for this park (Toronto Neighbourhood Profiles). Score is held at a neutral 50 with low confidence. Read with caution.
Source: Toronto Neighbourhood Profiles
Amenities (3 types · 3 records)
- playground
- sports field
- tennis
Nearby active-edge features (42)
- transit stop: Albion Rd at Todd Brook Dr59 m
- parking lot61 m
- transit stop: Kipling Avenue at Finch Avenue West74 m
- parking lot75 m
- transit stop: Albion Rd at Todd Brook Dr79 m
- parking lot84 m
- transit stop: Mount Olive94 m
- transit stop: Kipling Ave101 m
- transit stop: Mount Olive102 m
- retail: Canadian Tire Auto Repair105 m
- transit stop130 m
- rail133 m
- rail138 m
- transit stop: Kipling Avenue140 m
- retail: Usolve Financial146 m
- retail: Ryna’s Nails152 m
- transit stop: Penlea Avenue157 m
- transit stop: Finch Avenue West157 m
- retail: AVO Convenience159 m
- retail: Goodies Convenience170 m
- retail: Cellular Point171 m
- parking lot173 m
- retail: Fido174 m
- retail: MMY Gift Shop177 m
- retail: Family Leather179 m
- parking lot181 m
- retail: L&W Lingerie181 m
- retail: Fa's Apparel184 m
- restaurant: Pizza Pizza184 m
- retail: Sew Right186 m
- retail: Blossom Lady Accessories186 m
- retail: Rocchetti's Nails188 m
- retail: Daniel Watches & Jewellery191 m
- parking lot191 m
- retail: Lingerie Studio193 m
- retail: Samir Rugs193 m
- retail: Rogers193 m
- retail: WirelessWave196 m
- retail: We Got Games196 m
- retail: School Zone197 m
- transit stop: Albion Rd at Benstrow Ave198 m
- retail: Gateway Newstands199 m
Park profile
Five-axis radar across the structural dimensions.
Citywide percentile ranks
Across all Toronto parks in the dataset.
- Overall vitality96th
- Edge activation74th
- Connectivity90th
- Amenity diversity93th
- Natural comfort89th
- Enclosure25th
Most similar parks
Closest in metric space across the five structural dimensions.
- Adams ParkRavine / Naturalized Park49
- St. Lucie ParkRavine / Naturalized Park47
- Regent ParkOther52
- Dunlace ParkNeighbourhood Park50
- Chalkfarm ParkWaterfront Park39
Most opposite parks
Furthest in metric space. Useful for recognising what kind of park this isn’t.
- Joseph Burr Tyrrell ParkUrban Plaza50
- ALEX WILSON COMMUNITY GARDEN - Open Green SpaceUrban Plaza59
- Bernard Avenue Road AllowanceUrban Plaza54
- Queen'S Quay Traffic IslandWaterfront Park49
- Rouge ParkRavine / Naturalized Park18
Visitor signals
Public attention measured by Google Places aggregates. This proxies attention, not occupancy. Aggregate-only: no usernames, no review text, no extra photos beyond the cached hero.
p31 citywide · p26 within Waterfront Park
Source: Google Places API · match high (0.92 composite confidence) · last refreshed 5/9/2026. Privacy contract. Measures public attention, not occupancy.
Human activity signals: not available
No activity signals have landed for this park yet. The model has scored its physical form but it can’t yet say how often it’s programmed, photographed, or walked through. See /data-ethics for what we will and will not collect.
Does this score feel accurate?
Your read of Beaumonde Heights Parkmatters. We’re testing whether the model lines up with how people actually use the park. Submissions are stored locally; no account needed.
Tell us how this park feels
We measure structure (canopy, edges, connectivity). You measure feeling. Both matter, and disagreement is itself useful civic data.
What would improve this park?
Generated from the weakest measured dimensions: a starting point, not a prescription.
- Activate the edges: encourage cafés, retail or community uses on the streets that face the park; replace blank or parking-lot edges where possible.
- Diversify what people can do in the park (playground, washroom, water, shade, performance, sport, garden): even small additions raise this score.
Data sources
- City of Toronto Open Data: Parks (Green Space)Polygon boundaries, official names, types.
- Parks & Recreation FacilitiesInventory of in-park amenities (washrooms, fields, rinks…).
- Toronto Pedestrian NetworkSidewalk segments around and through parks; estimated park entrances.
- Toronto Centreline V2Street segments + intersection nodes near park edges; trails and walkways.
- Toronto 3D MassingBuilding footprints + heights for edge-building counts, frontage density, and tower-in-the-park risk.
- Toronto Treed AreaTree canopy share inside park polygons via stratified-grid sampling.
- Toronto Waterbodies & RiversWater surface inside parks + nearest-water distance for cooling.
- Ravine & Natural Feature ProtectionRavine overlap as a cooling / natural-comfort signal.
- Toronto Street Tree InventoryTree count + density inside park polygons.
- Neighbourhood Profiles(Pending) Equity context proxy.
- OpenStreetMap (Overpass API)Cafés, restaurants, retail, transit stops, parking, highways, rail.