Frank Faubert Wood Lot
Ravine / Naturalized Park, in the top tier overall (score 44, rank ~86th percentile). Strongest: natural comfort; weakest: edge activation.
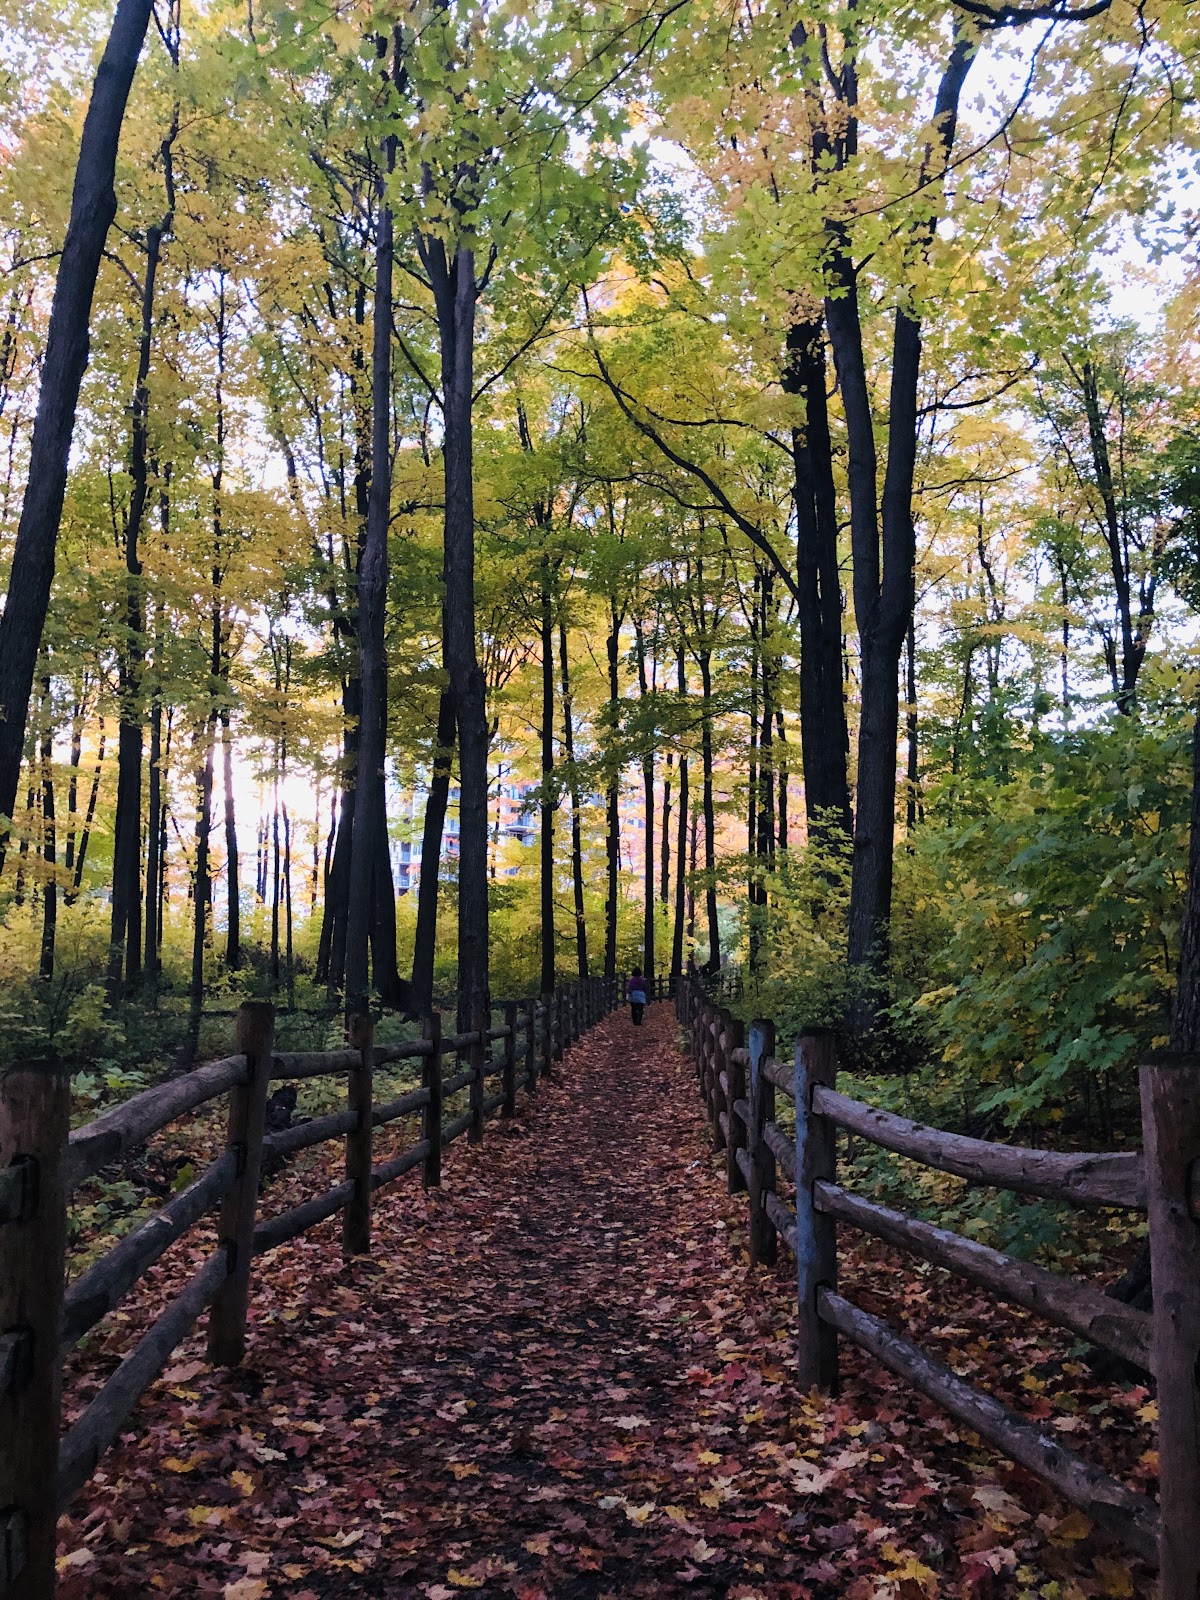
Photo by Himauli Patel via Google Places · cached 5/9/2026
Frank Faubert Wood Lot scores 43.5 / 100. Strongest dimensions: natural comfort and connectivity. Weakest: edge activation (0). Border-vacuum risk is low. This score is a transparent reading of Jane Jacobs-style vitality factors, not a definitive judgment.
Area · 5.40 ha
Weighted across six dimensions · confidence 72%
Scores are not bell-curved. Percentiles and expected scores provide context without changing the underlying model.
Loading map…
The parks map is loading.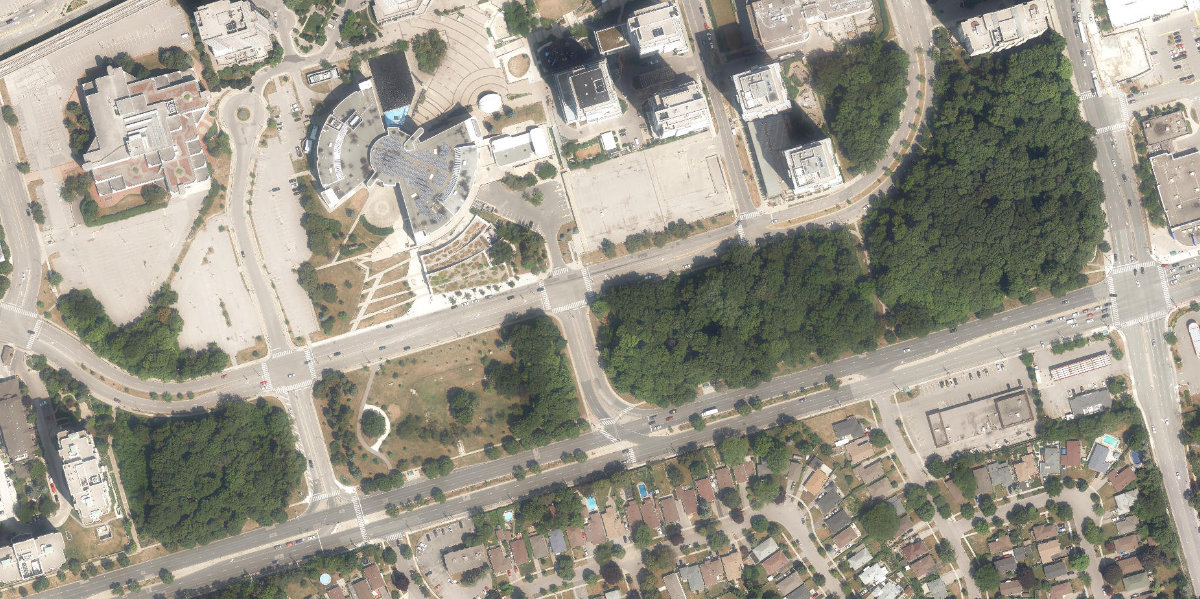
Explain this score
Where did the 44 come from? Each weighted contribution against a neutral 50 baseline. Green = pushed up; red = pulled down.
Sum of contributions = the headline score. A negative bar means that dimension dragged the park below the city-wide neutral baseline.
Why this park works
Frank Faubert Wood Lot works because its natural comfort score (87) is one of the city's strongest and its connectivity (69) is also top quartile (71% tree canopy provides real shade; it sits inside the ravine system).
What limits this park
Frank Faubert Wood Lot is held back by edge activation (0, below-average): the surrounding streets carry too few active uses to spill into the park.
Most distinctive characteristic
Most distinctive feature: exceptionally high natural comfort (87, top decile).
Jacobs reading
Frank Faubert Wood Lot sits between an urban social park and an ecological retreat: moderately useful for both, exceptionally suited to neither.
Tradeoffs
- The park is enclosed by buildings (68) but the surrounding streets are quiet (edge activation 0): frame without animation.
Performance in context
- A modest overperformer for its ravine / naturalized park typology (+8 vs the median in large Ravine / Naturalized Park ravine).
Typology classification
Classified as Ravine / Naturalized Park: 99% ravine overlap, 71% canopy. Secondary read: Corridor / Linear Park (shape elongation 2.2× a circle of equal area).
Edge Activation
Within 100 m of the park edge: 21 active uses (cafe, transit_stop, retail, restaurant) and 15 dead/hostile uses (parking_lot). Active edges keep "eyes on the park" through the day; parking lots, blank institutional walls, rail and highway frontages drain street life.
Source: OSM POIs (amenity/shop) + Toronto Building Footprints + land use
Connectivity
Connectivity blends paths, intersections, transit, entrances, and edge density. This park has 0 mapped paths/walkways and 61 sidewalk segments within 50 m; 10 street intersections within 100 m; 55 transit stops within a 400 m walk; 2 estimated access points across ~1,789 m of perimeter. moderate edge density, small superblock penalty applied. Source coverage: centreline, pedestrian_network, transit_osm.
Source: Toronto Centreline V2 + Pedestrian Network + OSM transit stops
Amenity Diversity
1 distinct amenity types in the park (dog_area). Diversity, not raw count, drives the score so a park with many distinct activity types can outrank a larger park that repeats the same use.
Source: Toronto Parks & Recreation Facilities + OSM amenity tags
Natural Comfort
Natural-comfort components for this park: 71.1% estimated tree canopy; 99.0% inside the ravine system; nearest waterbody ~816 m; 45 city-mapped trees inside the polygon (8.3/ha). Reading: ravine-cooled. Source coverage: treed_area, ravine, waterbodies, street_trees. Impervious surface is approximated (Toronto's authoritative layer ships only as a raster GeoTIFF).
Source: Toronto Treed Area + Ravine + Waterbodies + Street Tree Inventory
Enclosure / Eyes on Park
73 buildings within 25 m of the park edge (9 mid-rise, 51 low-rise, 13 tower); avg edge height 20.9 m (~7 floors); 4.1 buildings per 100 m of 1,789 m perimeter (strong frontage density); edges are at a Jacobs-scale walkable mid-rise (3 to 7 floors); 13 towers ≥ 40 m within 25 m of the edge. "Eyes on the park" come strongest from the 9 mid-rise edge buildings.
Source: Toronto 3D Massing (building footprints + heights)
Border Vacuum Risk
Border-vacuum factors within 50 m of the park: parking_lot, parking_lot. Jacobs warned that highways, rail, parking lots and blank institutional edges act as "vacuums" that suppress foot traffic and isolate the park from its neighbourhood.
Source: Toronto Street Centreline (highways) + rail layer + OSM landuse + building footprints
Equity Context
Equity Context requires inputs not yet loaded for this park (Toronto Neighbourhood Profiles). Score is held at a neutral 50 with low confidence. Read with caution.
Source: Toronto Neighbourhood Profiles
Amenities (1 types · 1 records)
- dog area
Nearby active-edge features (65)
- transit stop: Borough Approach East4 m
- transit stop: Borough Approach West5 m
- parking lot38 m
- transit stop: Packard Boulevard40 m
- transit stop: Ellesmere Rd at Saratoga Dr41 m
- transit stop: Ellesmere Rd at McCowan Rd44 m
- transit stop: Borough Approach East45 m
- parking lot47 m
- transit stop: McCowan Road49 m
- restaurant: All-Star Wings & Ribs49 m
- parking lot53 m
- parking lot58 m
- parking lot60 m
- transit stop: Ellesmere Road63 m
- parking lot64 m
- parking lot65 m
- retail: Global Pet Foods65 m
- restaurant: Subway65 m
- retail: But 'n' Ben Scottish Bakery71 m
- parking lot71 m
- restaurant: St Andrews Fish & Chips73 m
- parking lot74 m
- parking lot75 m
- parking lot77 m
- parking lot77 m
- parking lot80 m
- parking lot84 m
- cafe: Tim Hortons87 m
- retail: Circle K88 m
- parking lot88 m
- cafe: Tim Hortons89 m
- transit stop: Ellesmere Road91 m
- restaurant: St. Louis Bar & Grill92 m
- restaurant: Burger King96 m
- transit stop: Ellesmere Rd at Brimley Rd100 m
- retail: Neighbours100 m
- parking lot102 m
- transit stop: McCowan Road106 m
- parking lot109 m
- transit stop: Brimley Rd at Ellesmere Road115 m
- parking lot116 m
- parking lot117 m
- transit stop: McCowan Road118 m
- retail: Perfect Salon & Nails121 m
- parking lot: GreenP Carpark 710124 m
- transit stop: Bushby Drive at McCowan Road126 m
- parking lot131 m
- transit stop: McCowan Road at Town Centre Court136 m
- parking lot138 m
- transit stop: McCowan Road at Bushby Drive North Side138 m
- parking lot148 m
- retail: Gong Cha150 m
- parking lot160 m
- retail: Black Diamond Barber Shop169 m
- transit stop: Brimley Rd at Ellesmere Road174 m
- parking lot174 m
- transit stop: Brimley Rd at Golden Gate Court184 m
- transit stop: Town Centre/Scarborough Centre Station184 m
- transit stop: Brimley Rd at Omni Dr185 m
- transit stop: Ellesmere Rd at Brimley Rd190 m
- parking lot194 m
- parking lot195 m
- transit stop: Triton Road at McCowan Road198 m
- transit stop: Triton EB/McCowan199 m
- cafe: Tim Hortons200 m
Park profile
Five-axis radar across the structural dimensions.
Citywide percentile ranks
Across all Toronto parks in the dataset.
- Overall vitality86th
- Edge activation28th
- Connectivity89th
- Amenity diversity73th
- Natural comfort96th
- Enclosure65th
Most similar parks
Closest in metric space across the five structural dimensions.
- Merrill Bridge Road ParkRavine / Naturalized Park39
- Upwood GreenbeltWaterfront Park34
- Moccasin Trail ParkRavine / Naturalized Park32
- Mallow ParkRavine / Naturalized Park38
- Hague ParkWaterfront Park40
Most opposite parks
Furthest in metric space. Useful for recognising what kind of park this isn’t.
- Queen'S Quay Traffic IslandWaterfront Park49
- ALEX WILSON COMMUNITY GARDEN - Open Green SpaceUrban Plaza59
- Joseph Burr Tyrrell ParkUrban Plaza50
- Bernard Avenue Road AllowanceUrban Plaza54
- Danforth Gardens ParkParkette42
Visitor signals
Public attention measured by Google Places aggregates. This proxies attention, not occupancy. Aggregate-only: no usernames, no review text, no extra photos beyond the cached hero.
p24 citywide · p34 within Ravine / Naturalized Park
Source: Google Places API · match high (0.94 composite confidence) · last refreshed 5/9/2026. Privacy contract. Measures public attention, not occupancy.
Human activity signals: not available
No activity signals have landed for this park yet. The model has scored its physical form but it can’t yet say how often it’s programmed, photographed, or walked through. See /data-ethics for what we will and will not collect.
Does this score feel accurate?
Your read of Frank Faubert Wood Lotmatters. We’re testing whether the model lines up with how people actually use the park. Submissions are stored locally; no account needed.
Tell us how this park feels
We measure structure (canopy, edges, connectivity). You measure feeling. Both matter, and disagreement is itself useful civic data.
What would improve this park?
Generated from the weakest measured dimensions: a starting point, not a prescription.
- Activate the edges: encourage cafés, retail or community uses on the streets that face the park; replace blank or parking-lot edges where possible.
- Diversify what people can do in the park (playground, washroom, water, shade, performance, sport, garden): even small additions raise this score.
Data sources
- City of Toronto Open Data: Parks (Green Space)Polygon boundaries, official names, types.
- Parks & Recreation FacilitiesInventory of in-park amenities (washrooms, fields, rinks…).
- Toronto Pedestrian NetworkSidewalk segments around and through parks; estimated park entrances.
- Toronto Centreline V2Street segments + intersection nodes near park edges; trails and walkways.
- Toronto 3D MassingBuilding footprints + heights for edge-building counts, frontage density, and tower-in-the-park risk.
- Toronto Treed AreaTree canopy share inside park polygons via stratified-grid sampling.
- Toronto Waterbodies & RiversWater surface inside parks + nearest-water distance for cooling.
- Ravine & Natural Feature ProtectionRavine overlap as a cooling / natural-comfort signal.
- Toronto Street Tree InventoryTree count + density inside park polygons.
- Neighbourhood Profiles(Pending) Equity context proxy.
- OpenStreetMap (Overpass API)Cafés, restaurants, retail, transit stops, parking, highways, rail.