Bessarion Parkette
Parkette, one of the city's strongest overall (score 55, rank ~98th percentile). Strongest: enclosure; weakest: amenity diversity.
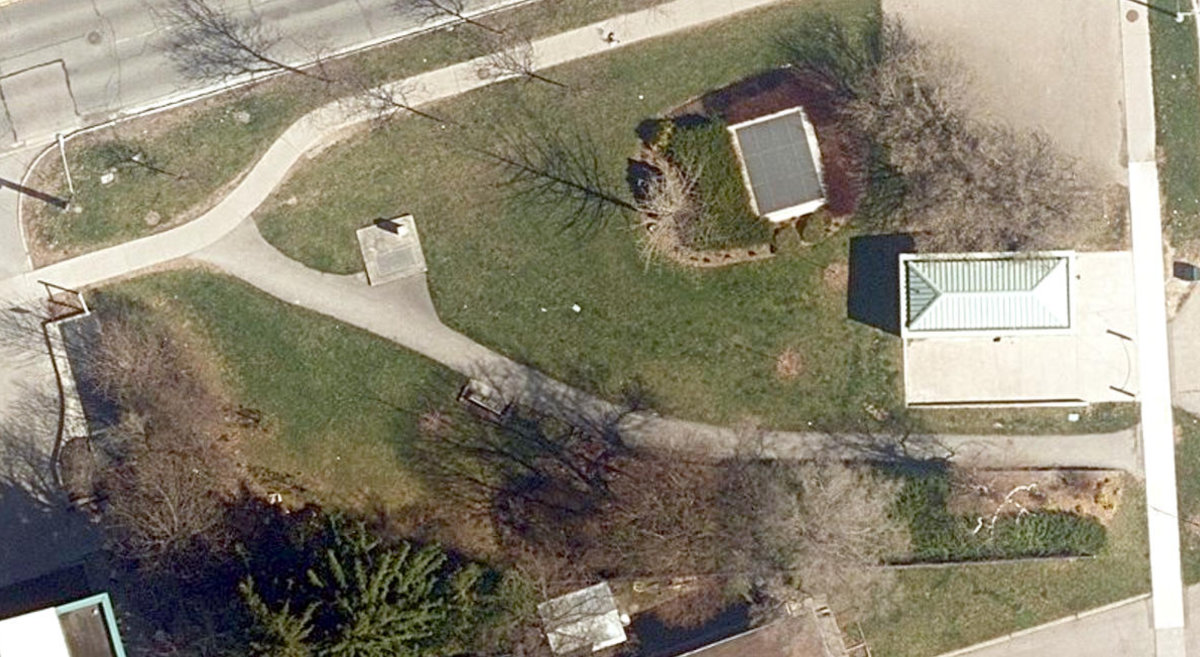
Aerial, City of Toronto orthophoto, ~8 cm/px source · cached 5/9/2026
Bessarion Parkette scores 55.4 / 100. Strongest dimensions: enclosure / eyes on park and natural comfort. Weakest: amenity diversity (0). Border-vacuum risk is low. This score is a transparent reading of Jane Jacobs-style vitality factors, not a definitive judgment.
Area · 0.11 ha
Weighted across six dimensions · confidence 61%
Scores are not bell-curved. Percentiles and expected scores provide context without changing the underlying model.
Loading map…
The parks map is loading.Explain this score
Where did the 55 come from? Each weighted contribution against a neutral 50 baseline. Green = pushed up; red = pulled down.
Sum of contributions = the headline score. A negative bar means that dimension dragged the park below the city-wide neutral baseline.
Why this park works
Bessarion Parkette works because its enclosure score (94) is one of the city's strongest and its edge activation (54) is also top decile (12 mid-rise buildings frame the edge with passive surveillance).
What limits this park
Bessarion Parkette is held back by amenity diversity (0, below-average).
Most distinctive characteristic
Most distinctive feature: exceptionally high enclosure (94, top decile).
Jacobs reading
Bessarion Parkette sits between an urban social park and an ecological retreat: moderately useful for both, exceptionally suited to neither.
Performance in context
- This park is a strong overperformer for its cohort: raw 55 versus an expected 31 for similar parks (pocket Parkette) (gap +24).
Typology classification
Classified as Parkette: small (1118 m²) with strong building frontage (25.2 per 100 m)
Edge Activation
Within 100 m of the park edge: 7 active uses (transit_stop, retail) and 0 dead/hostile uses (none). Active edges keep "eyes on the park" through the day; parking lots, blank institutional walls, rail and highway frontages drain street life.
Source: OSM POIs (amenity/shop) + Toronto Building Footprints + land use
Connectivity
Connectivity blends paths, intersections, transit, entrances, and edge density. This park has 1 mapped paths/walkways and 13 sidewalk segments within 50 m; 4 street intersections within 100 m; 10 transit stops within a 400 m walk; 3 estimated access points across ~143 m of perimeter. edge density is healthy, no superblock penalty. Source coverage: centreline, pedestrian_network, transit_osm.
Source: Toronto Centreline V2 + Pedestrian Network + OSM transit stops
Amenity Diversity
No amenities recorded. Score is 0 until inventory is loaded.
Source: Toronto Parks & Recreation Facilities + OSM amenity tags
Natural Comfort
Natural-comfort components for this park: 35.0% estimated tree canopy; nearest waterbody ~497 m; 5 city-mapped trees inside the polygon (5.0/ha). Reading: partially shaded. Source coverage: treed_area, waterbodies, street_trees. Impervious surface is approximated (Toronto's authoritative layer ships only as a raster GeoTIFF).
Source: Toronto Treed Area + Ravine + Waterbodies + Street Tree Inventory
Enclosure / Eyes on Park
36 buildings within 25 m of the park edge (12 mid-rise, 24 low-rise, 0 tower); avg edge height 9.8 m (~3 floors); 25.2 buildings per 100 m of 143 m perimeter (strong frontage density); edges are at a Jacobs-scale walkable mid-rise (3 to 7 floors); no towers immediately adjacent. "Eyes on the park" come strongest from the 12 mid-rise edge buildings.
Source: Toronto 3D Massing (building footprints + heights)
Border Vacuum Risk
Park edges face the city. No significant border vacuum detected.
Source: Toronto Street Centreline (highways) + rail layer + OSM landuse + building footprints
Equity Context
Equity Context requires inputs not yet loaded for this park (Toronto Neighbourhood Profiles). Score is held at a neutral 50 with low confidence. Read with caution.
Source: Toronto Neighbourhood Profiles
Amenities (0)
No amenities recorded for this park.
Nearby active-edge features (22)
- transit stop: Bessarion28 m
- transit stop: Bessarion32 m
- transit stop: Bessarion Avenue74 m
- transit stop: Sheppard Av - South76 m
- transit stop: Burbank Drive - Bessarion Station92 m
- retail: Shell Select99 m
- transit stop: Sheppard Av - North100 m
- retail: Fairstone Financial116 m
- retail: Kourosh Supermarket122 m
- parking lot123 m
- retail: Pet Valu135 m
- parking lot137 m
- retail: Sahara Travel141 m
- restaurant: Pizza Pizza145 m
- parking lot164 m
- parking lot168 m
- retail: Concord Park Place Presentation Centre171 m
- parking lot171 m
- retail: MEC North York Bike Shop176 m
- parking lot185 m
- parking lot197 m
- transit stop: Blue Ridge Road197 m
Park profile
Five-axis radar across the structural dimensions.
Citywide percentile ranks
Across all Toronto parks in the dataset.
- Overall vitality98th
- Edge activation97th
- Connectivity74th
- Amenity diversity35th
- Natural comfort83th
- Enclosure98th
Most similar parks
Closest in metric space across the five structural dimensions.
- ST. LEONARD'S CHURCH - Building GroundsParkette53
- Avalon ParketteParkette49
- Diamond Jubilee PromenadeCorridor / Linear Park50
- Humber River WatercourseRavine / Naturalized Park50
- City Wide Open SpaceParkette51
Most opposite parks
Furthest in metric space. Useful for recognising what kind of park this isn’t.
- Rouge ParkRavine / Naturalized Park21
- Rouge ParkRavine / Naturalized Park18
- Trca Lands ( 58)Waterfront Park18
- City Wide Open SpaceWaterfront Park21
- Rouge ParkWaterfront Park25
Human activity signals: not available
No activity signals have landed for this park yet. The model has scored its physical form but it can’t yet say how often it’s programmed, photographed, or walked through. See /data-ethics for what we will and will not collect.
Does this score feel accurate?
Your read of Bessarion Parkettematters. We’re testing whether the model lines up with how people actually use the park. Submissions are stored locally; no account needed.
Tell us how this park feels
We measure structure (canopy, edges, connectivity). You measure feeling. Both matter, and disagreement is itself useful civic data.
What would improve this park?
Generated from the weakest measured dimensions: a starting point, not a prescription.
- Diversify what people can do in the park (playground, washroom, water, shade, performance, sport, garden): even small additions raise this score.
Data sources
- City of Toronto Open Data: Parks (Green Space)Polygon boundaries, official names, types.
- Parks & Recreation FacilitiesInventory of in-park amenities (washrooms, fields, rinks…).
- Toronto Pedestrian NetworkSidewalk segments around and through parks; estimated park entrances.
- Toronto Centreline V2Street segments + intersection nodes near park edges; trails and walkways.
- Toronto 3D MassingBuilding footprints + heights for edge-building counts, frontage density, and tower-in-the-park risk.
- Toronto Treed AreaTree canopy share inside park polygons via stratified-grid sampling.
- Toronto Waterbodies & RiversWater surface inside parks + nearest-water distance for cooling.
- Ravine & Natural Feature ProtectionRavine overlap as a cooling / natural-comfort signal.
- Toronto Street Tree InventoryTree count + density inside park polygons.
- Neighbourhood Profiles(Pending) Equity context proxy.
- OpenStreetMap (Overpass API)Cafés, restaurants, retail, transit stops, parking, highways, rail.