Paul Garfinkel Parkette
Urban Plaza, one of the city's strongest overall (score 54, rank ~98th percentile). Strongest: enclosure; weakest: natural comfort.
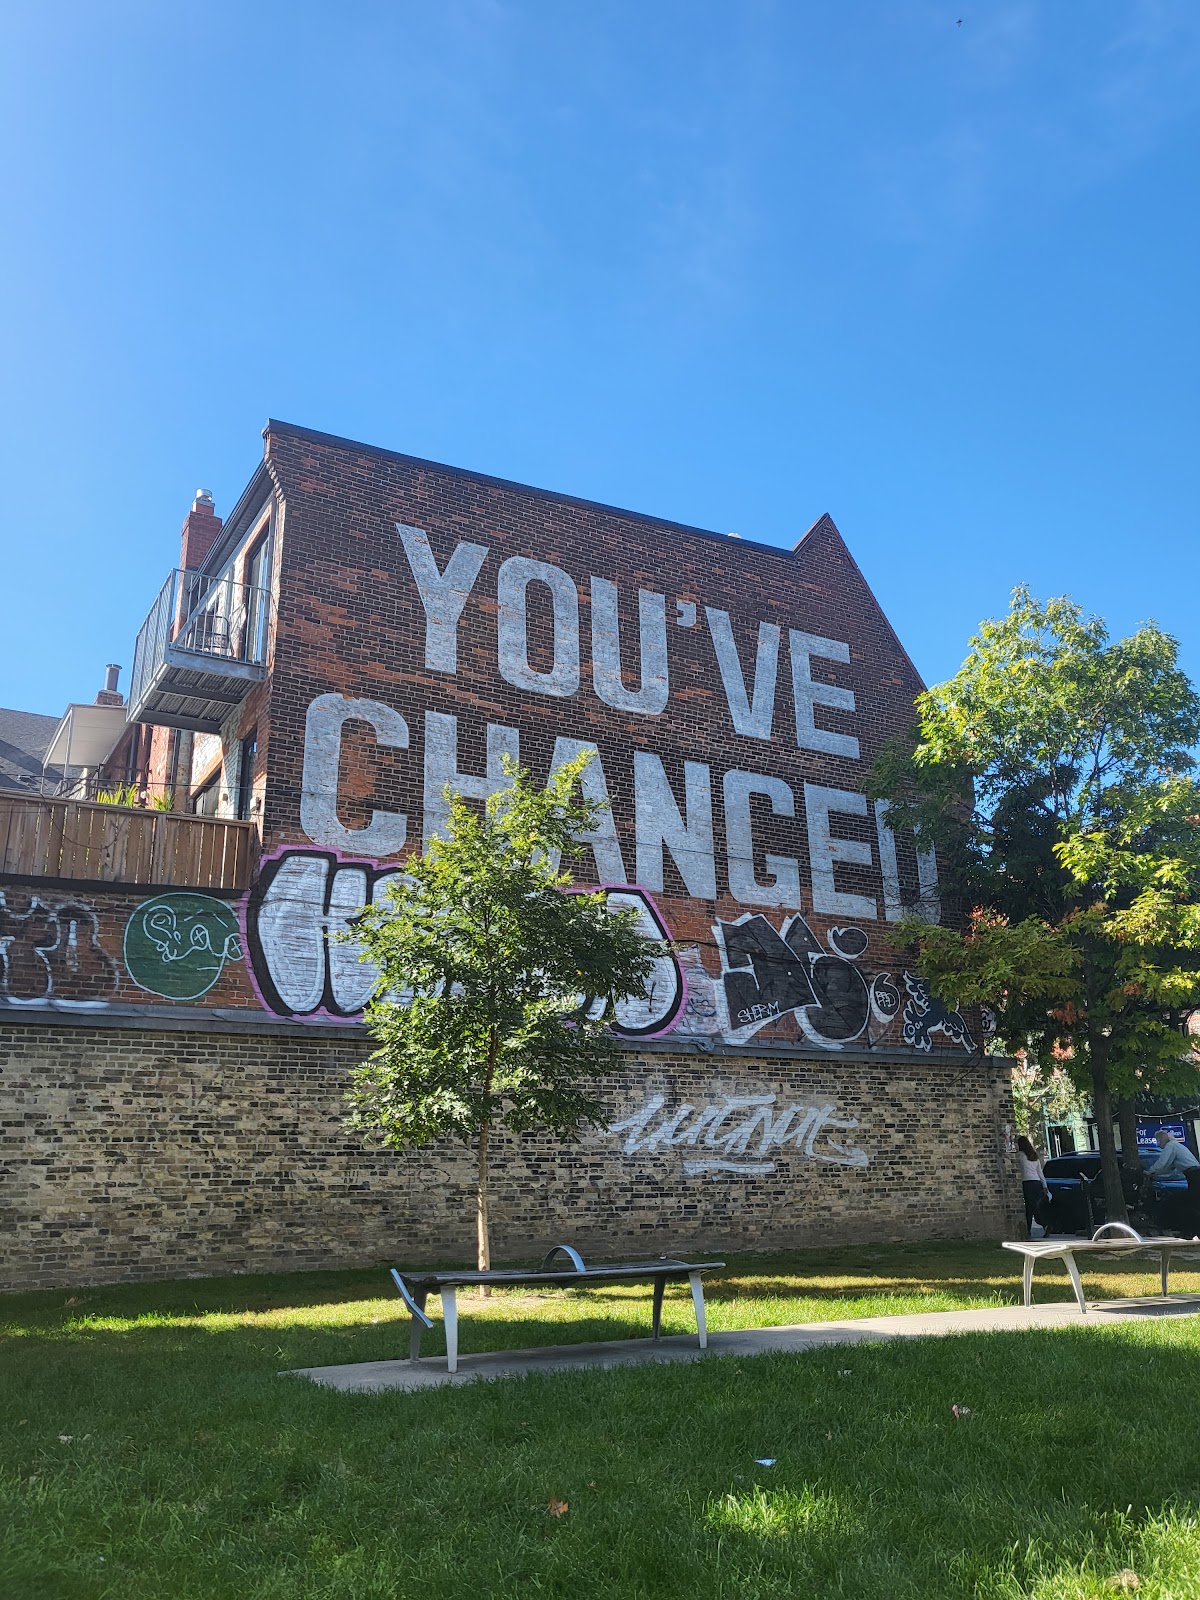
Photo by AJ via Google Places · cached 5/9/2026
Paul Garfinkel Parkette scores 54.1 / 100. Strongest dimensions: enclosure / eyes on park and edge activation. Weakest: amenity diversity (0). Border-vacuum risk is low. This score is a transparent reading of Jane Jacobs-style vitality factors, not a definitive judgment.
Area · 0.15 ha
Weighted across six dimensions · confidence 57%
Scores are not bell-curved. Percentiles and expected scores provide context without changing the underlying model.
Loading map…
The parks map is loading.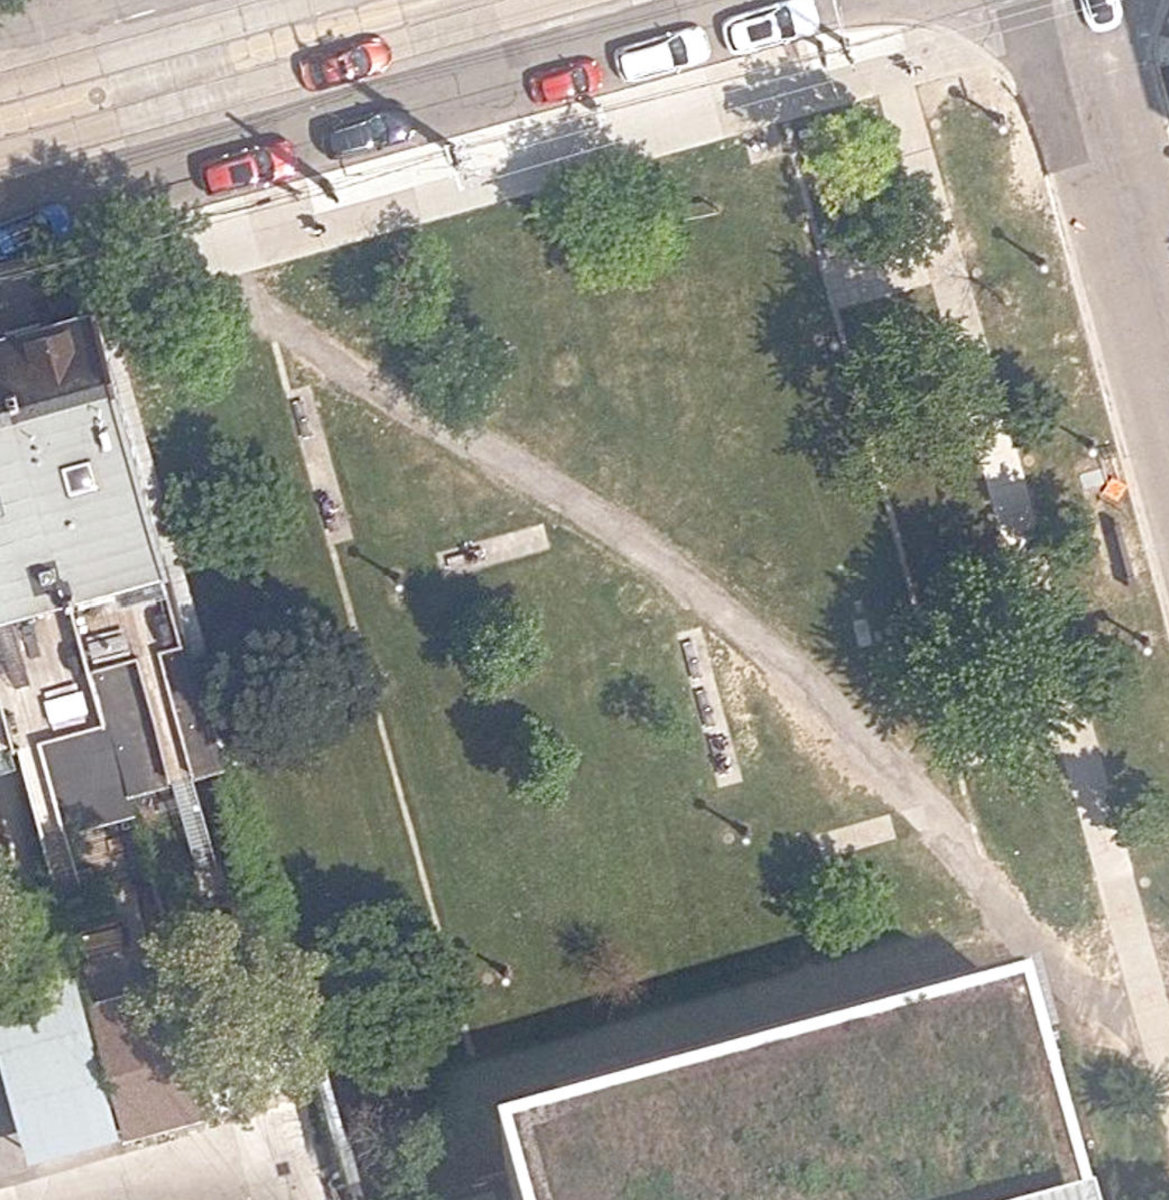
Explain this score
Where did the 54 come from? Each weighted contribution against a neutral 50 baseline. Green = pushed up; red = pulled down.
Sum of contributions = the headline score. A negative bar means that dimension dragged the park below the city-wide neutral baseline.
Why this park works
Paul Garfinkel Parkette works because its enclosure score (97) is one of the city's strongest and its edge activation (74) is also top decile (30 mid-rise buildings frame the edge with passive surveillance).
What limits this park
Paul Garfinkel Parkette is held back by natural comfort (36, below-average): only 0% canopy means little summer shade.
Most distinctive characteristic
Most distinctive feature: exceptionally high enclosure (97, top decile).
Jacobs reading
Paul Garfinkel Parkette sits between an urban social park and an ecological retreat: moderately useful for both, exceptionally suited to neither.
Performance in context
- This park is a strong overperformer for its cohort: raw 54 versus an expected 36 for similar parks (pocket Urban Plaza) (gap +18).
Typology classification
Classified as Urban Plaza: 1493 m², paved (0% canopy), 47.2 buildings/100 m
Edge Activation
Within 100 m of the park edge: 28 active uses (restaurant, retail, transit_stop, cafe) and 1 dead/hostile uses (parking_lot). Active edges keep "eyes on the park" through the day; parking lots, blank institutional walls, rail and highway frontages drain street life.
Source: OSM POIs (amenity/shop) + Toronto Building Footprints + land use
Connectivity
Connectivity blends paths, intersections, transit, entrances, and edge density. This park has 0 mapped paths/walkways and 16 sidewalk segments within 50 m; 10 street intersections within 100 m; 17 transit stops within a 400 m walk; 0 estimated access points across ~155 m of perimeter. edge density is healthy, no superblock penalty. Source coverage: centreline, pedestrian_network, transit_osm.
Source: Toronto Centreline V2 + Pedestrian Network + OSM transit stops
Amenity Diversity
No amenities recorded. Score is 0 until inventory is loaded.
Source: Toronto Parks & Recreation Facilities + OSM amenity tags
Natural Comfort
Natural-comfort components for this park: ~4.2% effective canopy (0.0% from contiguous tree polygons + scattered tree density); nearest waterbody ~1481 m; 6 city-mapped trees inside the polygon (6.0/ha). Reading: exposed. Source coverage: waterbodies, street_trees. Impervious surface is approximated (Toronto's authoritative layer ships only as a raster GeoTIFF).
Source: Toronto Treed Area + Ravine + Waterbodies + Street Tree Inventory
Enclosure / Eyes on Park
73 buildings within 25 m of the park edge (30 mid-rise, 43 low-rise, 0 tower); avg edge height 11.2 m (~4 floors); 47.2 buildings per 100 m of 155 m perimeter (strong frontage density); edges are at a Jacobs-scale walkable mid-rise (3 to 7 floors); no towers immediately adjacent. "Eyes on the park" come strongest from the 30 mid-rise edge buildings.
Source: Toronto 3D Massing (building footprints + heights)
Border Vacuum Risk
Border-vacuum factors within 50 m of the park: parking_lot. Jacobs warned that highways, rail, parking lots and blank institutional edges act as "vacuums" that suppress foot traffic and isolate the park from its neighbourhood.
Source: Toronto Street Centreline (highways) + rail layer + OSM landuse + building footprints
Equity Context
Equity Context requires inputs not yet loaded for this park (Toronto Neighbourhood Profiles). Score is held at a neutral 50 with low confidence. Read with caution.
Source: Toronto Neighbourhood Profiles
Amenities (0)
No amenities recorded for this park.
Nearby active-edge features (61)
- retail: Eye Wonder2 m
- retail: Quasi Modo11 m
- retail: Average16 m
- retail: Aeya Studios21 m
- restaurant: Butter Chicken Roti23 m
- retail: Royal23 m
- retail: Hopeless Romantic23 m
- restaurant: Bar Fancy23 m
- retail: Rec + Art History23 m
- restaurant: Bar Piquette28 m
- restaurant: Jamil's Chaat House31 m
- retail: Dynasty34 m
- transit stop: Dovercourt Road34 m
- retail37 m
- parking lot44 m
- restaurant: Church46 m
- retail: Mario's Garage47 m
- cafe: Out Of This World Café53 m
- retail: Axes Smoke60 m
- retail: Cambie64 m
- transit stop: Dovercourt Road66 m
- retail: Garb68 m
- retail69 m
- retail: Poppies75 m
- restaurant: Good Son83 m
- retail: Queen of Bud86 m
- restaurant: Entice90 m
- restaurant: The Dog & Bear Pub95 m
- restaurant: Wallen98 m
- parking lot101 m
- retail: Craft Ontario106 m
- parking lot113 m
- restaurant: Poutini’s House of Poutine120 m
- retail: Birds of North America124 m
- restaurant: Queen Star Restaurant129 m
- retail: Cozey131 m
- restaurant: Fat Bastard Burrito133 m
- restaurant: The Burger's Priest137 m
- cafe: Cafe Neon139 m
- parking lot140 m
- restaurant: Hello 123144 m
- retail: Six Vapes145 m
- retail: Planet of Sound150 m
- retail: Wine Rack155 m
- cafe: Tim Hortons157 m
- restaurant: Pizza Pizza168 m
- retail: Gravitypope173 m
- parking lot176 m
- restaurant176 m
- parking lot180 m
- transit stop: Ossington Avenue180 m
- retail182 m
- retail: Vape Palace187 m
- restaurant: Levetto187 m
- restaurant: Subway188 m
- parking lot192 m
- retail: Convenience Canada192 m
- retail: Glad Day193 m
- retail: Parlour196 m
- transit stop: Abell Street197 m
- transit stop: Queen Street West199 m
Park profile
Five-axis radar across the structural dimensions.
Citywide percentile ranks
Across all Toronto parks in the dataset.
- Overall vitality98th
- Edge activation99th
- Connectivity71th
- Amenity diversity36th
- Natural comfort26th
- Enclosure100th
Most similar parks
Closest in metric space across the five structural dimensions.
- Bernard Avenue Road AllowanceUrban Plaza54
- Grace - College ParketteCorridor / Linear Park59
- Montclair Avenue ParketteUrban Plaza50
- Lakeview Avenue ParketteUrban Plaza52
- Shaw St Traffic Median SouthCorridor / Linear Park52
Most opposite parks
Furthest in metric space. Useful for recognising what kind of park this isn’t.
- Toronto Islands - Muggs Island ParkRavine / Naturalized Park25
- Trca Lands ( 26)Ravine / Naturalized Park27
- Rouge ParkWaterfront Park25
- Rouge ParkRavine / Naturalized Park28
- Rouge ParkRavine / Naturalized Park26
Visitor signals
Public attention measured by Google Places aggregates. This proxies attention, not occupancy. Aggregate-only: no usernames, no review text, no extra photos beyond the cached hero.
p42 citywide · p30 within Urban Plaza
Source: Google Places API · match unverified (0.00 composite confidence) · last refreshed 5/9/2026. Privacy contract. Measures public attention, not occupancy.
Human activity signals: not available
No activity signals have landed for this park yet. The model has scored its physical form but it can’t yet say how often it’s programmed, photographed, or walked through. See /data-ethics for what we will and will not collect.
Does this score feel accurate?
Your read of Paul Garfinkel Parkettematters. We’re testing whether the model lines up with how people actually use the park. Submissions are stored locally; no account needed.
Tell us how this park feels
We measure structure (canopy, edges, connectivity). You measure feeling. Both matter, and disagreement is itself useful civic data.
What would improve this park?
Generated from the weakest measured dimensions: a starting point, not a prescription.
- Diversify what people can do in the park (playground, washroom, water, shade, performance, sport, garden): even small additions raise this score.
- Increase canopy and reduce paved area. Shade and water features extend usable hours and seasons.
Data sources
- City of Toronto Open Data: Parks (Green Space)Polygon boundaries, official names, types.
- Parks & Recreation FacilitiesInventory of in-park amenities (washrooms, fields, rinks…).
- Toronto Pedestrian NetworkSidewalk segments around and through parks; estimated park entrances.
- Toronto Centreline V2Street segments + intersection nodes near park edges; trails and walkways.
- Toronto 3D MassingBuilding footprints + heights for edge-building counts, frontage density, and tower-in-the-park risk.
- Toronto Treed AreaTree canopy share inside park polygons via stratified-grid sampling.
- Toronto Waterbodies & RiversWater surface inside parks + nearest-water distance for cooling.
- Ravine & Natural Feature ProtectionRavine overlap as a cooling / natural-comfort signal.
- Toronto Street Tree InventoryTree count + density inside park polygons.
- Neighbourhood Profiles(Pending) Equity context proxy.
- OpenStreetMap (Overpass API)Cafés, restaurants, retail, transit stops, parking, highways, rail.