John Chang Neighbourhood Park
Urban Plaza, above average overall (score 41, rank ~78th percentile). Strongest: enclosure; weakest: edge activation.
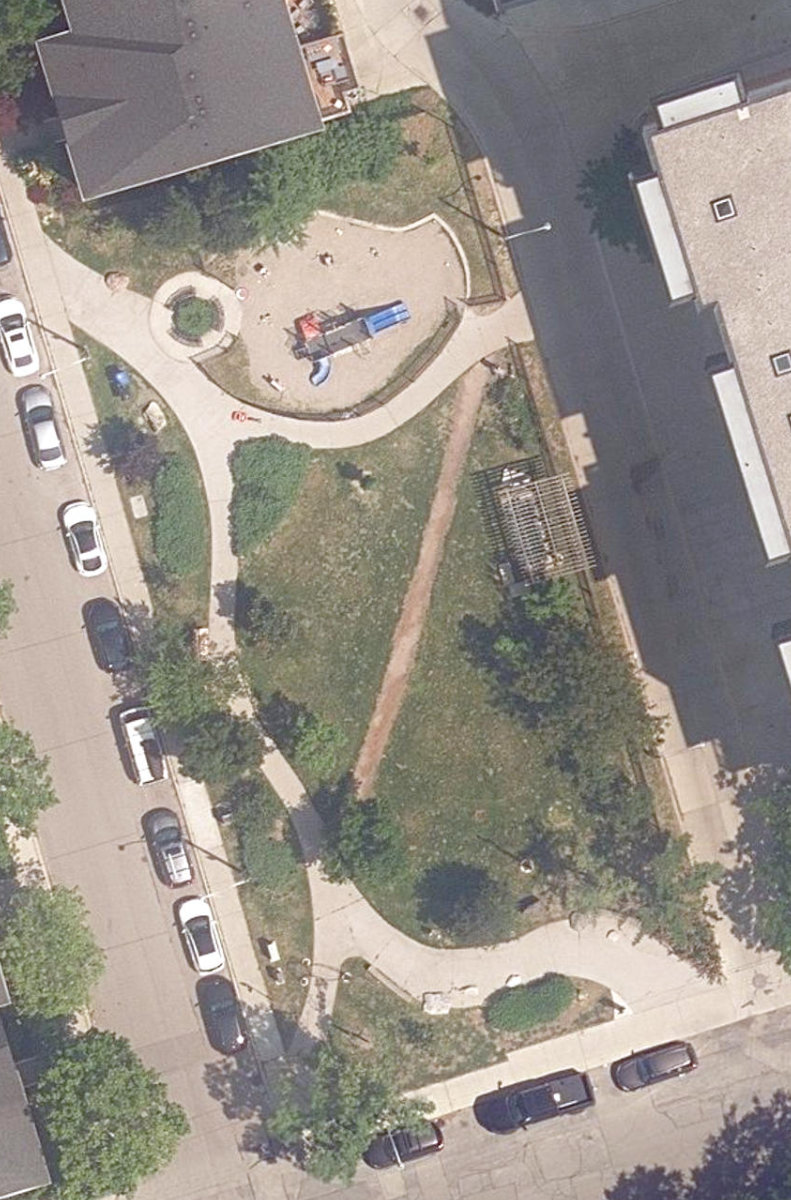
Aerial, City of Toronto orthophoto, ~8 cm/px source · cached 5/9/2026
John Chang Neighbourhood Park scores 40.7 / 100. Strongest dimensions: enclosure / eyes on park and connectivity. Weakest: edge activation (0). Border-vacuum risk is low. This score is a transparent reading of Jane Jacobs-style vitality factors, not a definitive judgment.
Area · 0.13 ha
Weighted across six dimensions · confidence 66%
Scores are not bell-curved. Percentiles and expected scores provide context without changing the underlying model.
Loading map…
The parks map is loading.Explain this score
Where did the 41 come from? Each weighted contribution against a neutral 50 baseline. Green = pushed up; red = pulled down.
Sum of contributions = the headline score. A negative bar means that dimension dragged the park below the city-wide neutral baseline.
Why this park works
John Chang Neighbourhood Park works because its enclosure score (97) is one of the city's strongest and its connectivity (68) is also top quartile (42 mid-rise buildings frame the edge with passive surveillance).
What limits this park
John Chang Neighbourhood Park is held back by edge activation (0, below-average): the surrounding streets carry too few active uses to spill into the park.
Most distinctive characteristic
Most distinctive feature: exceptionally high enclosure (97, top decile).
Jacobs reading
John Chang Neighbourhood Park sits between an urban social park and an ecological retreat: moderately useful for both, exceptionally suited to neither.
Tradeoffs
- Connectivity (68) significantly outpaces natural comfort (41): well placed in the city but offers little shade or ecological respite.
- The park is enclosed by buildings (97) but the surrounding streets are quiet (edge activation 0): frame without animation.
Typology classification
Classified as Urban Plaza: 1274 m², paved (0% canopy), 45.0 buildings/100 m
Edge Activation
Within 100 m of the park edge: 1 active uses (retail) and 4 dead/hostile uses (parking_lot). Active edges keep "eyes on the park" through the day; parking lots, blank institutional walls, rail and highway frontages drain street life.
Source: OSM POIs (amenity/shop) + Toronto Building Footprints + land use
Connectivity
Connectivity blends paths, intersections, transit, entrances, and edge density. This park has 5 mapped paths/walkways and 10 sidewalk segments within 50 m; 11 street intersections within 100 m; 15 transit stops within a 400 m walk; 4 estimated access points across ~153 m of perimeter. edge density is healthy, no superblock penalty. Source coverage: centreline, pedestrian_network, transit_osm.
Source: Toronto Centreline V2 + Pedestrian Network + OSM transit stops
Amenity Diversity
1 distinct amenity types in the park (playground). Diversity, not raw count, drives the score so a park with many distinct activity types can outrank a larger park that repeats the same use.
Source: Toronto Parks & Recreation Facilities + OSM amenity tags
Natural Comfort
Natural-comfort components for this park: ~7.7% effective canopy (0.0% from contiguous tree polygons + scattered tree density); nearest waterbody ~1046 m; 11 city-mapped trees inside the polygon (11.0/ha). Reading: exposed. Source coverage: waterbodies, street_trees. Impervious surface is approximated (Toronto's authoritative layer ships only as a raster GeoTIFF).
Source: Toronto Treed Area + Ravine + Waterbodies + Street Tree Inventory
Enclosure / Eyes on Park
69 buildings within 25 m of the park edge (42 mid-rise, 27 low-rise, 0 tower); avg edge height 9.3 m (~3 floors); 45.0 buildings per 100 m of 153 m perimeter (strong frontage density); edges are at a Jacobs-scale walkable mid-rise (3 to 7 floors); no towers immediately adjacent. "Eyes on the park" come strongest from the 42 mid-rise edge buildings.
Source: Toronto 3D Massing (building footprints + heights)
Border Vacuum Risk
Border-vacuum factors within 50 m of the park: parking_lot. Jacobs warned that highways, rail, parking lots and blank institutional edges act as "vacuums" that suppress foot traffic and isolate the park from its neighbourhood.
Source: Toronto Street Centreline (highways) + rail layer + OSM landuse + building footprints
Equity Context
Equity Context requires inputs not yet loaded for this park (Toronto Neighbourhood Profiles). Score is held at a neutral 50 with low confidence. Read with caution.
Source: Toronto Neighbourhood Profiles
Amenities (1 types · 1 records)
- playground
Nearby active-edge features (66)
- parking lot34 m
- parking lot71 m
- parking lot72 m
- retail: Surf the Greats74 m
- parking lot98 m
- transit stop: 250 Carlaw Avenue100 m
- parking lot103 m
- retail: Value Village118 m
- transit stop121 m
- cafe: Shirley's First Break122 m
- retail: Starks Barber Company122 m
- retail: Brick Street Bakery129 m
- retail: Maral Salon135 m
- retail: Fuzz Wax Bar135 m
- retail: Poka Dottie's Dog Grooming135 m
- retail: Studio One Tattoo Supplies136 m
- retail: Platis Cleaners136 m
- retail: Canopy Kids137 m
- restaurant: My Roti Place Xprss137 m
- retail: Mona Spa Nails138 m
- retail: House of Vapes139 m
- restaurant: Masa Deli139 m
- retail: Ollie Quinn141 m
- retail142 m
- retail: Queen Books144 m
- retail: Good Market146 m
- transit stop: Queen Street East148 m
- retail: Craig’s Cookies150 m
- parking lot158 m
- transit stop: Logan Avenue160 m
- restaurant: Ramona's Kitchen161 m
- cafe: Mercury Espresso161 m
- retail161 m
- retail: Glass Monocle161 m
- parking lot162 m
- restaurant: Mean Bao162 m
- cafe: Nutbar168 m
- restaurant: Maestro's170 m
- retail: Rowe Farms171 m
- retail: The Source Bulk Foods171 m
- retail: All-Way Convenience172 m
- cafe: Maha’s Cafe172 m
- retail: Leslieville Cheese Market East & Fine Foods173 m
- transit stop: Carlaw Avenue174 m
- restaurant: EAT BKK175 m
- transit stop: Logan Avenue175 m
- cafe: Purple Penguin Cafe177 m
- retail: Culture Athletics178 m
- restaurant: Juzz Sushi179 m
- retail: Leslieville Massage Therapy180 m
- retail: easyfinancial181 m
- retail: Good Neighbour182 m
- restaurant: The Roy184 m
- retail: Morrison & Co.185 m
- retail: Kotn187 m
- retail: La Bamboche Bakery188 m
- retail: Logan Motors Used Car Sales191 m
- cafe: Starbucks191 m
- retail192 m
- retail: Benjamin Moore192 m
- transit stop: Carlaw Avenue194 m
- restaurant: A&W195 m
- retail: Hooked196 m
- restaurant: Freshii197 m
- retail: Alter198 m
- transit stop: Queen Street East199 m
Park profile
Five-axis radar across the structural dimensions.
Citywide percentile ranks
Across all Toronto parks in the dataset.
- Overall vitality78th
- Edge activation27th
- Connectivity88th
- Amenity diversity73th
- Natural comfort40th
- Enclosure100th
Most similar parks
Closest in metric space across the five structural dimensions.
- Erwin Krickhahn ParkUrban Plaza40
- Bell Manor ParkParkette33
- Winchester ParkParkette40
- Dalesford ParkUrban Plaza38
- Mount Royal ParketteUrban Plaza40
Most opposite parks
Furthest in metric space. Useful for recognising what kind of park this isn’t.
- Toronto Islands - Muggs Island ParkRavine / Naturalized Park25
- Trca Lands ( 26)Ravine / Naturalized Park27
- Rouge ParkWaterfront Park25
- Rouge ParkRavine / Naturalized Park28
- Rouge ParkRavine / Naturalized Park21
Human activity signals: not available
No activity signals have landed for this park yet. The model has scored its physical form but it can’t yet say how often it’s programmed, photographed, or walked through. See /data-ethics for what we will and will not collect.
Does this score feel accurate?
Your read of John Chang Neighbourhood Parkmatters. We’re testing whether the model lines up with how people actually use the park. Submissions are stored locally; no account needed.
Tell us how this park feels
We measure structure (canopy, edges, connectivity). You measure feeling. Both matter, and disagreement is itself useful civic data.
What would improve this park?
Generated from the weakest measured dimensions: a starting point, not a prescription.
- Activate the edges: encourage cafés, retail or community uses on the streets that face the park; replace blank or parking-lot edges where possible.
- Diversify what people can do in the park (playground, washroom, water, shade, performance, sport, garden): even small additions raise this score.
- Increase canopy and reduce paved area. Shade and water features extend usable hours and seasons.
Data sources
- City of Toronto Open Data: Parks (Green Space)Polygon boundaries, official names, types.
- Parks & Recreation FacilitiesInventory of in-park amenities (washrooms, fields, rinks…).
- Toronto Pedestrian NetworkSidewalk segments around and through parks; estimated park entrances.
- Toronto Centreline V2Street segments + intersection nodes near park edges; trails and walkways.
- Toronto 3D MassingBuilding footprints + heights for edge-building counts, frontage density, and tower-in-the-park risk.
- Toronto Treed AreaTree canopy share inside park polygons via stratified-grid sampling.
- Toronto Waterbodies & RiversWater surface inside parks + nearest-water distance for cooling.
- Ravine & Natural Feature ProtectionRavine overlap as a cooling / natural-comfort signal.
- Toronto Street Tree InventoryTree count + density inside park polygons.
- Neighbourhood Profiles(Pending) Equity context proxy.
- OpenStreetMap (Overpass API)Cafés, restaurants, retail, transit stops, parking, highways, rail.