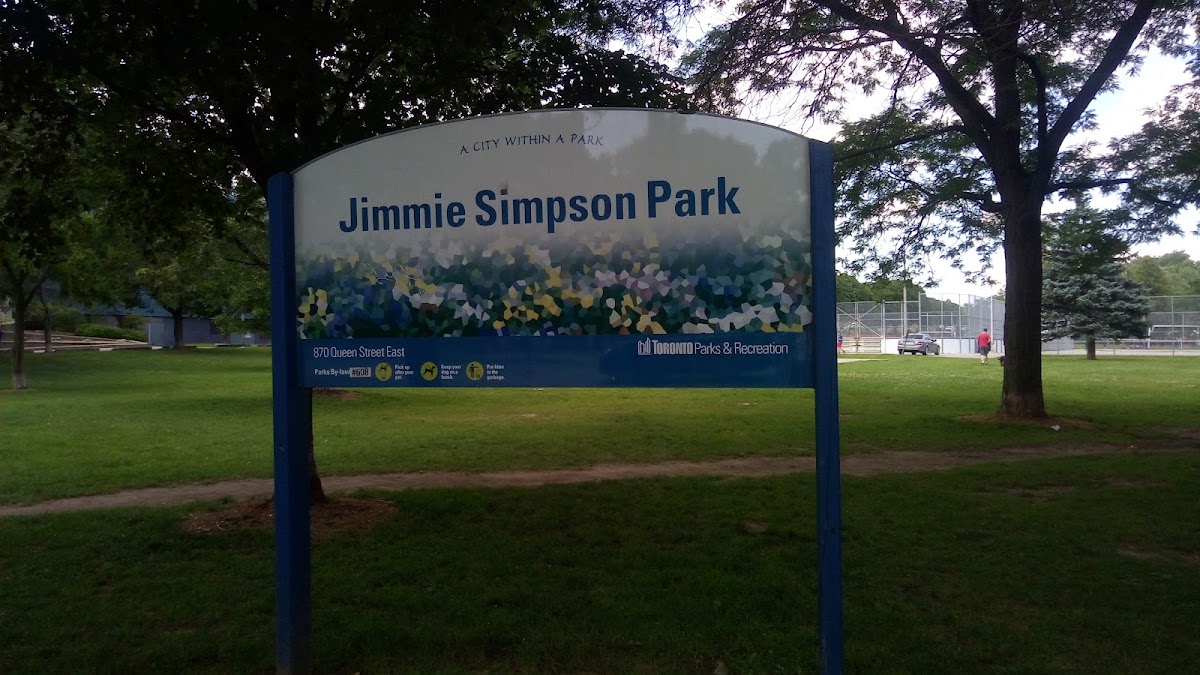
Jimmie Simpson Park
Athletic / Recreation Park, in the top tier overall (score 45, rank ~89th percentile). Strongest: amenity diversity; weakest: natural comfort.
Photo by Suzen Haig via Google Places · cached 5/9/2026
Jimmie Simpson Park scores 45.3 / 100. Strongest dimensions: enclosure / eyes on park and connectivity. Weakest: edge activation (24). Border-vacuum risk is elevated (84). This score is a transparent reading of Jane Jacobs-style vitality factors, not a definitive judgment.
Area · 2.69 ha
Weighted across six dimensions · confidence 72%
Scores are not bell-curved. Percentiles and expected scores provide context without changing the underlying model.
Loading map…
The parks map is loading.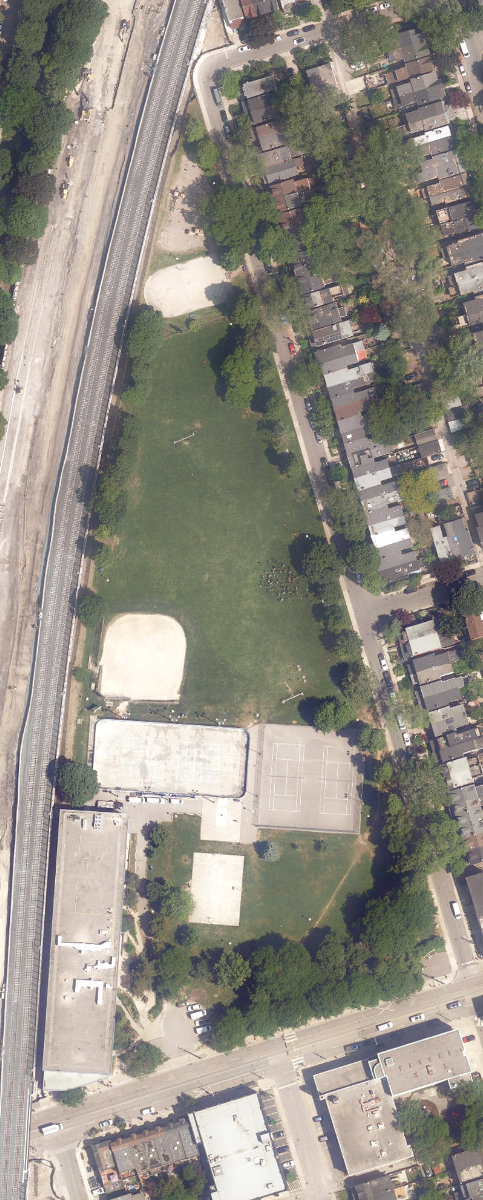
Explain this score
Where did the 45 come from? Each weighted contribution against a neutral 50 baseline. Green = pushed up; red = pulled down.
Sum of contributions = the headline score. A negative bar means that dimension dragged the park below the city-wide neutral baseline.
Why this park works
Jimmie Simpson Park works because its amenity diversity score (48) is one of the city's strongest and its connectivity (71) is also top decile (7 distinct amenity types support different kinds of use).
What limits this park
Jimmie Simpson Park is held back by natural comfort (37, below-average): only 1% canopy means little summer shade; border-vacuum risk is also elevated (84).
Most distinctive characteristic
Most distinctive feature: exceptionally high amenity diversity (48, top decile).
Jacobs reading
Jimmie Simpson Park sits between an urban social park and an ecological retreat: moderately useful for both, exceptionally suited to neither.
Tradeoffs
- Connectivity (71) significantly outpaces natural comfort (37): well placed in the city but offers little shade or ecological respite.
- The park is enclosed by buildings (82) but the surrounding streets are quiet (edge activation 24): frame without animation.
- High connectivity coexists with high border-vacuum risk (84): much of that connectivity is to highways, rail, or parking lots, not to neighbourhoods.
Performance in context
- Citywide rank is high (89th) but typology rank is more modest (64th): the strength likely comes from the dataset average pulling lower than this typology’s baseline.
Typology classification
Classified as Athletic / Recreation Park: 57% of amenity types are athletic (basketball, skatepark, sports_field, tennis). Secondary read: Neighbourhood Park (2.7 ha, framed by 28 mid-rise vs 0 towers).
Edge Activation
Within 100 m of the park edge: 24 active uses (retail, restaurant, cafe, transit_stop) and 7 dead/hostile uses (rail, parking_lot). Active edges keep "eyes on the park" through the day; parking lots, blank institutional walls, rail and highway frontages drain street life.
Source: OSM POIs (amenity/shop) + Toronto Building Footprints + land use
Connectivity
Connectivity blends paths, intersections, transit, entrances, and edge density. This park has 4 mapped paths/walkways and 30 sidewalk segments within 50 m; 32 street intersections within 100 m; 19 transit stops within a 400 m walk; 2 estimated access points across ~839 m of perimeter. edge density is healthy, no superblock penalty. Source coverage: centreline, pedestrian_network, transit_osm.
Source: Toronto Centreline V2 + Pedestrian Network + OSM transit stops
Amenity Diversity
7 distinct amenity types in the park (basketball, picnic, playground, skatepark, sports_field, tennis, …). Diversity, not raw count, drives the score so a park with many distinct activity types can outrank a larger park that repeats the same use.
Source: Toronto Parks & Recreation Facilities + OSM amenity tags
Natural Comfort
Natural-comfort components for this park: ~3.1% effective canopy (0.5% from contiguous tree polygons + scattered tree density); nearest waterbody ~831 m; 12 city-mapped trees inside the polygon (4.5/ha). Reading: exposed. Source coverage: treed_area, waterbodies, street_trees. Impervious surface is approximated (Toronto's authoritative layer ships only as a raster GeoTIFF).
Source: Toronto Treed Area + Ravine + Waterbodies + Street Tree Inventory
Enclosure / Eyes on Park
116 buildings within 25 m of the park edge (28 mid-rise, 88 low-rise, 0 tower); avg edge height 8.0 m (~3 floors); 13.8 buildings per 100 m of 839 m perimeter (strong frontage density); edges are low-rise (mostly 2 to 3 floors); no towers immediately adjacent. "Eyes on the park" come strongest from the 28 mid-rise edge buildings.
Source: Toronto 3D Massing (building footprints + heights)
Border Vacuum Risk
Border-vacuum factors within 50 m of the park: Kingston Subdivision, Kingston Subdivision, Kingston Subdivision, Kingston Subdivision, parking_lot. Jacobs warned that highways, rail, parking lots and blank institutional edges act as "vacuums" that suppress foot traffic and isolate the park from its neighbourhood.
Source: Toronto Street Centreline (highways) + rail layer + OSM landuse + building footprints
Equity Context
Equity Context requires inputs not yet loaded for this park (Toronto Neighbourhood Profiles). Score is held at a neutral 50 with low confidence. Read with caution.
Source: Toronto Neighbourhood Profiles
Amenities (7 types · 7 records)
- basketball
- picnic
- playground
- skatepark
- sports field
- tennis
- washroom
Nearby active-edge features (80)
- rail: Kingston Subdivision0 m
- rail: Kingston Subdivision0 m
- parking lot0 m
- transit stop: Empire Avenue7 m
- transit stop: Empire Avenue11 m
- rail: Kingston Subdivision15 m
- rail: Kingston Subdivision18 m
- restaurant: The Castle on Queen20 m
- retail: K.L. Coin Co.26 m
- retail: Pet Valu34 m
- retail: Hooked37 m
- retail43 m
- retail: La Bamboche Bakery49 m
- restaurant: The Roy56 m
- retail: Circle K58 m
- restaurant: Juzz Sushi62 m
- retail: Bonjour Brioche64 m
- restaurant: Osmow's66 m
- restaurant: EAT BKK68 m
- restaurant: Tabule72 m
- restaurant: Freshii73 m
- retail: All-Way Convenience74 m
- rail: Kingston Subdivision74 m
- rail: Kingston Subdivision76 m
- restaurant: A&W79 m
- retail: Jimmy's Coffee83 m
- transit stop: Logan Avenue88 m
- retail: Dirty Pawz88 m
- transit stop: Boulton Avenue90 m
- cafe: Starbucks90 m
- cafe: Tim Hortons95 m
- retail: Craig’s Cookies113 m
- transit stop: Logan Avenue114 m
- retail: Brick Street Bakery115 m
- transit stop: Saulter Street115 m
- restaurant: Chez Nous116 m
- cafe: Purple Penguin Cafe118 m
- cafe: Amber Kitchen and Coffee119 m
- retail: Hair by Banks & Co121 m
- retail: Leslieville Cheese Market East & Fine Foods122 m
- retail: Good Market123 m
- retail: Glassbox Barbershop127 m
- retail: Rowe Farms129 m
- retail: Queen Books129 m
- rail: Kingston Subdivision131 m
- rail: Kingston Subdivision132 m
- parking lot132 m
- retail: Thyme Studio132 m
- retail: Arts Market133 m
- retail135 m
- retail: Teimuri Bespoke Tailoring137 m
- retail: The Source Bulk Foods138 m
- retail: Papas Laundry140 m
- retail: Ollie Quinn141 m
- transit stop145 m
- restaurant: Maestro's145 m
- restaurant: Kismet148 m
- retail: Leslieville Massage Therapy151 m
- cafe: Queen Garden Cafe155 m
- restaurant: Lacarnita156 m
- cafe: Nutbar159 m
- retail: LCBO163 m
- retail: Value Village165 m
- retail: Dollarama172 m
- retail: Glass Monocle173 m
- retail179 m
- parking lot181 m
- retail: Good Juice Box Vintage182 m
- rail: Kingston Subdivision183 m
- rail: Kingston Subdivision184 m
- restaurant: Ramona's Kitchen186 m
- community: Ralph Thornton Community Center190 m
- rail: Kingston Subdivision191 m
- retail: Fuzz Wax Bar191 m
- retail: Waxon191 m
- rail: Kingston Subdivision193 m
- cafe: Mercury Espresso193 m
- retail: Paper & Poste193 m
- retail: Maral Salon195 m
- retail: Common Sort198 m
Park profile
Five-axis radar across the structural dimensions.
Citywide percentile ranks
Across all Toronto parks in the dataset.
- Overall vitality89th
- Edge activation80th
- Connectivity92th
- Amenity diversity100th
- Natural comfort30th
- Enclosure87th
Most similar parks
Closest in metric space across the five structural dimensions.
- Wanless ParkAthletic / Recreation Park52
- Greenwood ParkNeighbourhood Park58
- Fred Hamilton PlaygroundNeighbourhood Park56
- Regent Park Athletic GroundsAthletic / Recreation Park52
- Dentonia ParkAthletic / Recreation Park47
Most opposite parks
Furthest in metric space. Useful for recognising what kind of park this isn’t.
- Trca Lands ( 26)Ravine / Naturalized Park27
- Toronto Islands - Muggs Island ParkRavine / Naturalized Park25
- Rouge ParkRavine / Naturalized Park28
- Rouge ParkWaterfront Park25
- Rouge ParkRavine / Naturalized Park26
Visitor signals
Public attention measured by Google Places aggregates. This proxies attention, not occupancy. Aggregate-only: no usernames, no review text, no extra photos beyond the cached hero.
p84 citywide · p81 within Athletic / Recreation Park
Source: Google Places API · match high (1.00 composite confidence) · last refreshed 5/9/2026. Privacy contract. Measures public attention, not occupancy.
Human activity signals: not available
No activity signals have landed for this park yet. The model has scored its physical form but it can’t yet say how often it’s programmed, photographed, or walked through. See /data-ethics for what we will and will not collect.
Does this score feel accurate?
Your read of Jimmie Simpson Parkmatters. We’re testing whether the model lines up with how people actually use the park. Submissions are stored locally; no account needed.
Tell us how this park feels
We measure structure (canopy, edges, connectivity). You measure feeling. Both matter, and disagreement is itself useful civic data.
What would improve this park?
Generated from the weakest measured dimensions: a starting point, not a prescription.
- Activate the edges: encourage cafés, retail or community uses on the streets that face the park; replace blank or parking-lot edges where possible.
- Diversify what people can do in the park (playground, washroom, water, shade, performance, sport, garden): even small additions raise this score.
- Increase canopy and reduce paved area. Shade and water features extend usable hours and seasons.
- Mitigate border vacuums (highways, rail, parking) with active programming on the still-permeable edges and treat the hostile edge as a design challenge.
Data sources
- City of Toronto Open Data: Parks (Green Space)Polygon boundaries, official names, types.
- Parks & Recreation FacilitiesInventory of in-park amenities (washrooms, fields, rinks…).
- Toronto Pedestrian NetworkSidewalk segments around and through parks; estimated park entrances.
- Toronto Centreline V2Street segments + intersection nodes near park edges; trails and walkways.
- Toronto 3D MassingBuilding footprints + heights for edge-building counts, frontage density, and tower-in-the-park risk.
- Toronto Treed AreaTree canopy share inside park polygons via stratified-grid sampling.
- Toronto Waterbodies & RiversWater surface inside parks + nearest-water distance for cooling.
- Ravine & Natural Feature ProtectionRavine overlap as a cooling / natural-comfort signal.
- Toronto Street Tree InventoryTree count + density inside park polygons.
- Neighbourhood Profiles(Pending) Equity context proxy.
- OpenStreetMap (Overpass API)Cafés, restaurants, retail, transit stops, parking, highways, rail.