Thomson Memorial Park
Civic Square, in the top tier overall (score 46, rank ~91th percentile). Strongest: amenity diversity; weakest: enclosure.
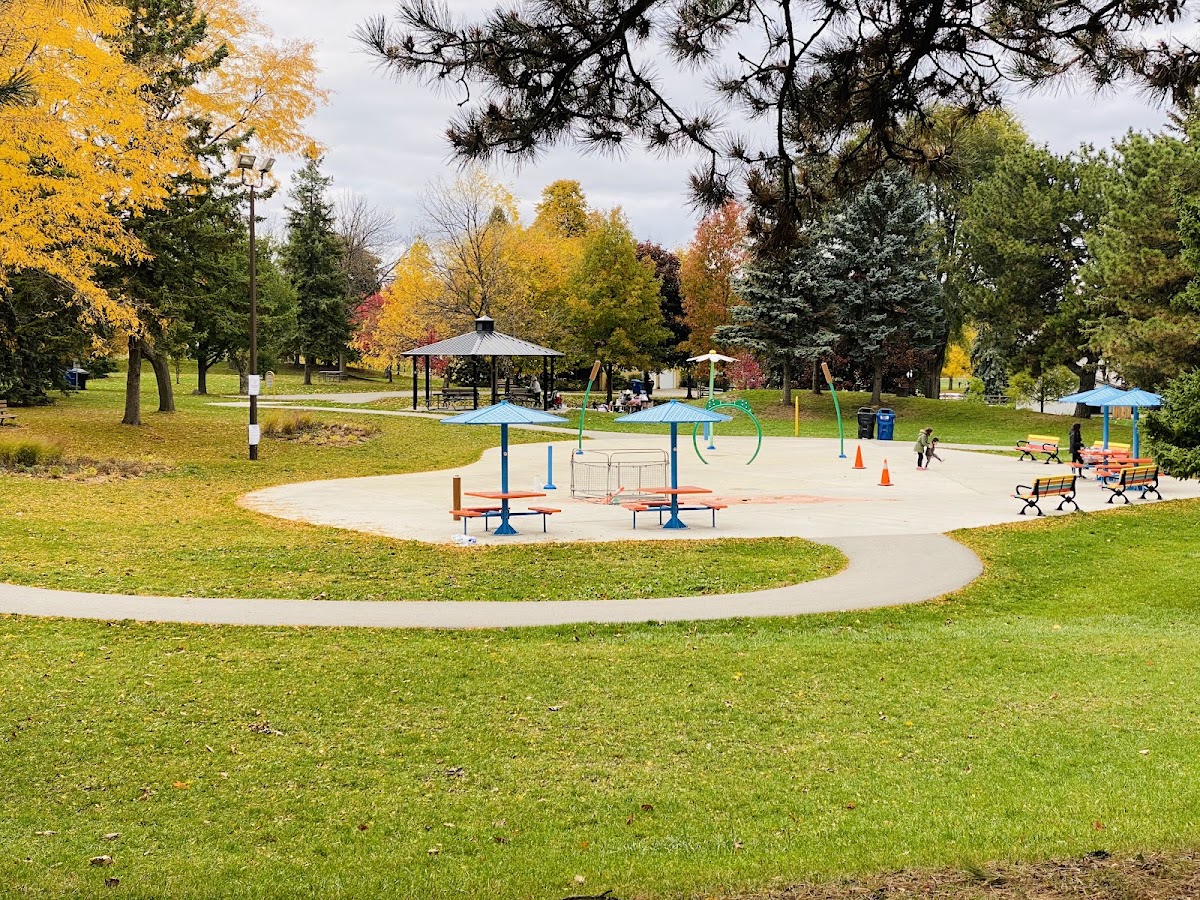
Photo by Sonam Tsering via Google Places · cached 5/9/2026
Thomson Memorial Park scores 46.4 / 100. Strongest dimensions: connectivity and natural comfort. Weakest: edge activation (11.8). Border-vacuum risk is elevated (84). This score is a transparent reading of Jane Jacobs-style vitality factors, not a definitive judgment.
Area · 41.84 ha
Weighted across six dimensions · confidence 72%
Scores are not bell-curved. Percentiles and expected scores provide context without changing the underlying model.
Loading map…
The parks map is loading.
Explain this score
Where did the 46 come from? Each weighted contribution against a neutral 50 baseline. Green = pushed up; red = pulled down.
Sum of contributions = the headline score. A negative bar means that dimension dragged the park below the city-wide neutral baseline.
Why this park works
Thomson Memorial Park works because its amenity diversity score (47) is one of the city's strongest and its connectivity (84) is also top decile (7 distinct amenity types support different kinds of use).
What limits this park
Thomson Memorial Park is held back by enclosure (57, bottom quartile); border-vacuum risk is also elevated (84).
Most distinctive characteristic
Most distinctive feature: exceptionally high amenity diversity (47, top decile).
Jacobs reading
Thomson Memorial Park sits between an urban social park and an ecological retreat: moderately useful for both, exceptionally suited to neither.
Tradeoffs
- High connectivity coexists with high border-vacuum risk (84): much of that connectivity is to highways, rail, or parking lots, not to neighbourhoods.
Performance in context
- A modest overperformer for its civic square typology (+7 vs the median in Civic Square).
Typology classification
Classified as Civic Square: name flags as civic square + 5.4 buildings per 100 m frontage. Secondary read: Ravine / Naturalized Park (42% ravine overlap, 21% canopy).
Edge Activation
Within 100 m of the park edge: 31 active uses (transit_stop, retail, restaurant, cafe) and 9 dead/hostile uses (parking_lot). Active edges keep "eyes on the park" through the day; parking lots, blank institutional walls, rail and highway frontages drain street life.
Source: OSM POIs (amenity/shop) + Toronto Building Footprints + land use
Connectivity
Connectivity blends paths, intersections, transit, entrances, and edge density. This park has 111 mapped paths/walkways and 154 sidewalk segments within 50 m; 41 street intersections within 100 m; 32 transit stops within a 400 m walk; 32 estimated access points across ~4,702 m of perimeter. moderate edge density, small superblock penalty applied. Source coverage: centreline, pedestrian_network, transit_osm.
Source: Toronto Centreline V2 + Pedestrian Network + OSM transit stops
Amenity Diversity
7 distinct amenity types in the park (dog_area, fitness, picnic, playground, sports_field, tennis, …). Diversity, not raw count, drives the score so a park with many distinct activity types can outrank a larger park that repeats the same use.
Source: Toronto Parks & Recreation Facilities + OSM amenity tags
Natural Comfort
Natural-comfort components for this park: 20.7% estimated tree canopy; 42.0% inside the ravine system; 2.4% water surface; 153 city-mapped trees inside the polygon (3.7/ha). Reading: ravine-cooled. Source coverage: treed_area, ravine, waterbodies, street_trees. Impervious surface is approximated (Toronto's authoritative layer ships only as a raster GeoTIFF).
Source: Toronto Treed Area + Ravine + Waterbodies + Street Tree Inventory
Enclosure / Eyes on Park
252 buildings within 25 m of the park edge (6 mid-rise, 246 low-rise, 0 tower); avg edge height 4.6 m (~2 floors); 5.4 buildings per 100 m of 4,702 m perimeter (strong frontage density); edges are barely there or single-storey; no towers immediately adjacent. "Eyes on the park" come strongest from the 6 mid-rise edge buildings.
Source: Toronto 3D Massing (building footprints + heights)
Border Vacuum Risk
Border-vacuum factors within 50 m of the park: parking_lot, parking_lot, parking_lot, parking_lot, parking_lot, parking_lot, parking_lot. Jacobs warned that highways, rail, parking lots and blank institutional edges act as "vacuums" that suppress foot traffic and isolate the park from its neighbourhood.
Source: Toronto Street Centreline (highways) + rail layer + OSM landuse + building footprints
Equity Context
Equity Context requires inputs not yet loaded for this park (Toronto Neighbourhood Profiles). Score is held at a neutral 50 with low confidence. Read with caution.
Source: Toronto Neighbourhood Profiles
Amenities (7 types · 7 records)
- dog area
- fitness
- picnic
- playground
- sports field
- tennis
- washroom
Nearby active-edge features (60)
- transit stop: Brimley Rd at Dorcot Ave0 m
- transit stop: Brimley Rd at Britwell Ave0 m
- transit stop: Brimley Rd at Lawrence Ave E0 m
- parking lot0 m
- parking lot0 m
- parking lot0 m
- parking lot0 m
- parking lot1 m
- transit stop: Brimley Road3 m
- transit stop: St. Andrews Road3 m
- transit stop: Brimley Road5 m
- transit stop13 m
- transit stop: St. Andrews Road21 m
- transit stop: Brimley Rd at Britwell Ave21 m
- transit stop: Brimley Rd at Dorcot Ave22 m
- transit stop: Brimley Rd at Lawrence Ave E24 m
- transit stop: Marcos Boulevard25 m
- parking lot30 m
- transit stop: Benleigh Drive31 m
- parking lot42 m
- retail: Growers Retail53 m
- restaurant: Ahmutha Surabi65 m
- retail65 m
- restaurant: Merigold Restaurant66 m
- retail: Ruby & Ruby Sarees Palace66 m
- retail66 m
- retail: Dollar Plus66 m
- retail: SP Fish Market66 m
- retail: SP Importers67 m
- transit stop: Benleigh Drive71 m
- transit stop: St. Andrews Road75 m
- retail: Bombay Foods Cash "N" Carry82 m
- retail86 m
- restaurant: Yumys Chicken and Seafood88 m
- restaurant: Pam Court89 m
- parking lot91 m
- parking lot94 m
- retail94 m
- retail96 m
- cafe: Tim Hortons98 m
- transit stop: Barrymore Road103 m
- restaurant: Nostos Bar & Grill103 m
- parking lot103 m
- transit stop: Bellechasse Street107 m
- parking lot110 m
- transit stop: Applefield Drive110 m
- transit stop: Danielle Moore Circle112 m
- transit stop: Barrymore Road113 m
- retail: Blue Sky Bakery114 m
- restaurant: Patty Time123 m
- parking lot131 m
- retail132 m
- parking lot132 m
- parking lot137 m
- retail: Minuteman Press137 m
- parking lot151 m
- retail: Top Food Fresh Mart159 m
- parking lot163 m
- transit stop: Meldazy Drive (South)194 m
- parking lot196 m
Park profile
Five-axis radar across the structural dimensions.
Citywide percentile ranks
Across all Toronto parks in the dataset.
- Overall vitality91th
- Edge activation71th
- Connectivity100th
- Amenity diversity100th
- Natural comfort80th
- Enclosure23th
Most similar parks
Closest in metric space across the five structural dimensions.
- Centennial Park - EtobicokeWaterfront Park41
- West Deane ParkRavine / Naturalized Park42
- Milliken ParkDestination Park46
- L'Amoreaux North ParkWaterfront Park44
- Earl Bales ParkRavine / Naturalized Park41
Most opposite parks
Furthest in metric space. Useful for recognising what kind of park this isn’t.
- Joseph Burr Tyrrell ParkUrban Plaza50
- Rouge ParkRavine / Naturalized Park18
- Bernard Avenue Road AllowanceUrban Plaza54
- Trca Lands ( 58)Waterfront Park18
- Queen'S Quay Traffic IslandWaterfront Park49
Visitor signals
Public attention measured by Google Places aggregates. This proxies attention, not occupancy. Aggregate-only: no usernames, no review text, no extra photos beyond the cached hero.
“Large wooded park featuring a playground & sports, plus fitness equipment, trails & more.” (Google editorial summary)
p93 citywide · p79 within Civic Square
Source: Google Places API · match high (0.98 composite confidence) · last refreshed 5/9/2026. Privacy contract. Measures public attention, not occupancy.
Human activity signals: not available
No activity signals have landed for this park yet. The model has scored its physical form but it can’t yet say how often it’s programmed, photographed, or walked through. See /data-ethics for what we will and will not collect.
Does this score feel accurate?
Your read of Thomson Memorial Parkmatters. We’re testing whether the model lines up with how people actually use the park. Submissions are stored locally; no account needed.
Tell us how this park feels
We measure structure (canopy, edges, connectivity). You measure feeling. Both matter, and disagreement is itself useful civic data.
What would improve this park?
Generated from the weakest measured dimensions: a starting point, not a prescription.
- Activate the edges: encourage cafés, retail or community uses on the streets that face the park; replace blank or parking-lot edges where possible.
- Diversify what people can do in the park (playground, washroom, water, shade, performance, sport, garden): even small additions raise this score.
- Mitigate border vacuums (highways, rail, parking) with active programming on the still-permeable edges and treat the hostile edge as a design challenge.
Data sources
- City of Toronto Open Data: Parks (Green Space)Polygon boundaries, official names, types.
- Parks & Recreation FacilitiesInventory of in-park amenities (washrooms, fields, rinks…).
- Toronto Pedestrian NetworkSidewalk segments around and through parks; estimated park entrances.
- Toronto Centreline V2Street segments + intersection nodes near park edges; trails and walkways.
- Toronto 3D MassingBuilding footprints + heights for edge-building counts, frontage density, and tower-in-the-park risk.
- Toronto Treed AreaTree canopy share inside park polygons via stratified-grid sampling.
- Toronto Waterbodies & RiversWater surface inside parks + nearest-water distance for cooling.
- Ravine & Natural Feature ProtectionRavine overlap as a cooling / natural-comfort signal.
- Toronto Street Tree InventoryTree count + density inside park polygons.
- Neighbourhood Profiles(Pending) Equity context proxy.
- OpenStreetMap (Overpass API)Cafés, restaurants, retail, transit stops, parking, highways, rail.