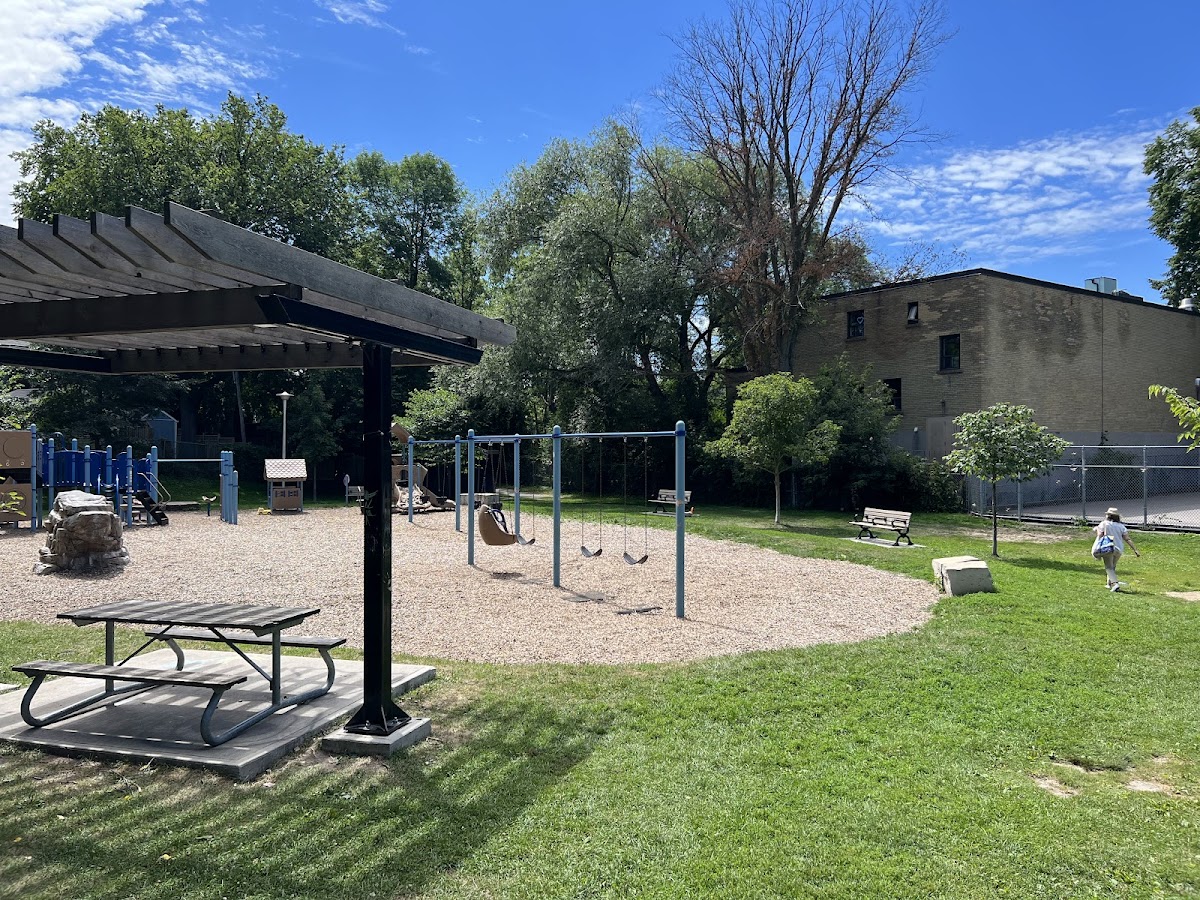
Moncur Playground
Neighbourhood Park, in the top tier overall (score 49, rank ~94th percentile). Strongest: amenity diversity; weakest: connectivity.
Photo by Michael M via Google Places · cached 5/9/2026
Moncur Playground scores 48.7 / 100. Strongest dimensions: enclosure / eyes on park and natural comfort. Weakest: amenity diversity (21). Border-vacuum risk is low. This score is a transparent reading of Jane Jacobs-style vitality factors, not a definitive judgment.
Area · 1.14 ha
Weighted across six dimensions · confidence 72%
Scores are not bell-curved. Percentiles and expected scores provide context without changing the underlying model.
Loading map…
The parks map is loading.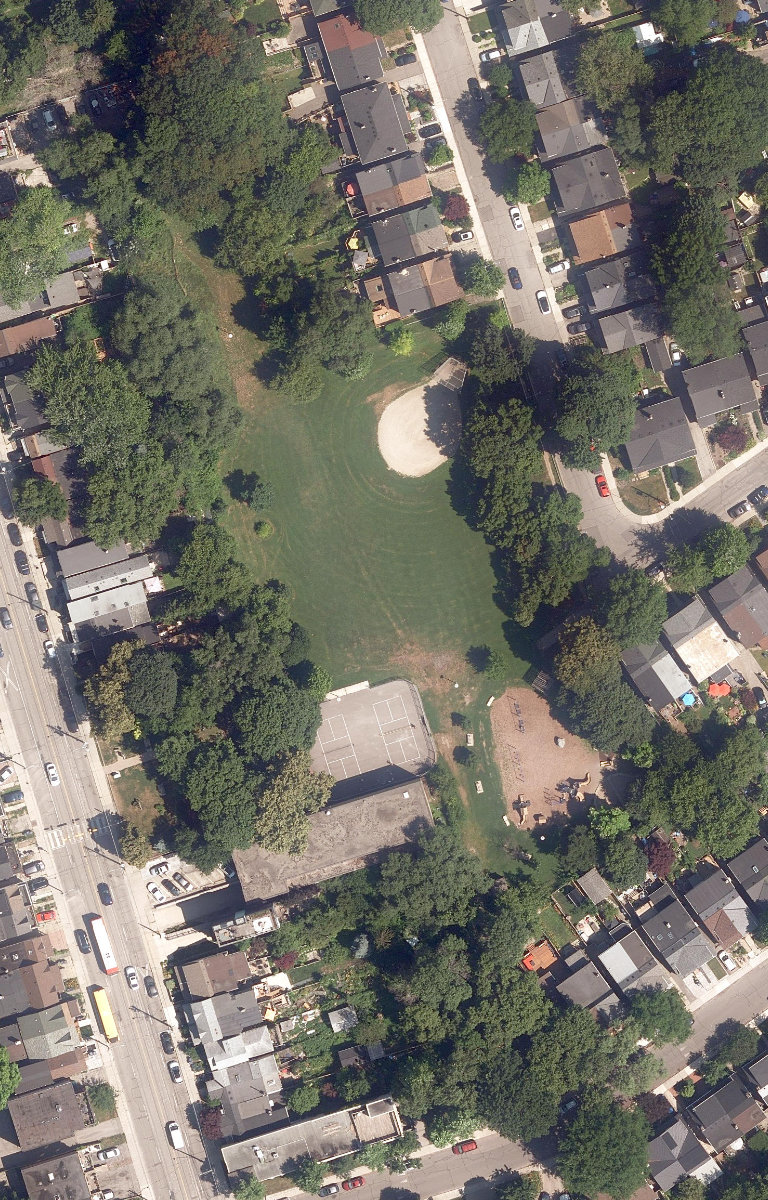
Explain this score
Where did the 49 come from? Each weighted contribution against a neutral 50 baseline. Green = pushed up; red = pulled down.
Sum of contributions = the headline score. A negative bar means that dimension dragged the park below the city-wide neutral baseline.
Why this park works
Moncur Playground works because its amenity diversity score (21) is in the top tier and its natural comfort (68) is also top quartile.
What limits this park
Moncur Playground doesn't have a clear weakness. Every measured dimension is at or above the middle of the pack.
Most distinctive characteristic
Most distinctive feature: exceptionally high amenity diversity (21, top decile).
Jacobs reading
Moncur Playground sits between an urban social park and an ecological retreat: moderately useful for both, exceptionally suited to neither.
Tradeoffs
- The park is enclosed by buildings (78) but the surrounding streets are quiet (edge activation 24): frame without animation.
Performance in context
- A modest overperformer for its neighbourhood park typology (+11 vs the median in medium Neighbourhood Park).
Typology classification
Classified as Neighbourhood Park: 1.1 ha, framed by 14 mid-rise vs 0 towers
Edge Activation
Within 100 m of the park edge: 4 active uses (transit_stop, retail) and 2 dead/hostile uses (parking_lot). Active edges keep "eyes on the park" through the day; parking lots, blank institutional walls, rail and highway frontages drain street life.
Source: OSM POIs (amenity/shop) + Toronto Building Footprints + land use
Connectivity
Connectivity blends paths, intersections, transit, entrances, and edge density. This park has 1 mapped paths/walkways and 10 sidewalk segments within 50 m; 7 street intersections within 100 m; 14 transit stops within a 400 m walk; 1 estimated access points across ~665 m of perimeter. moderate edge density, small superblock penalty applied. Source coverage: centreline, pedestrian_network, transit_osm.
Source: Toronto Centreline V2 + Pedestrian Network + OSM transit stops
Amenity Diversity
2 distinct amenity types in the park (playground, sports_field). Diversity, not raw count, drives the score so a park with many distinct activity types can outrank a larger park that repeats the same use.
Source: Toronto Parks & Recreation Facilities + OSM amenity tags
Natural Comfort
Natural-comfort components for this park: 32.1% estimated tree canopy; nearest waterbody ~617 m; 23 city-mapped trees inside the polygon (20.3/ha). Reading: partially shaded. Source coverage: treed_area, waterbodies, street_trees. Impervious surface is approximated (Toronto's authoritative layer ships only as a raster GeoTIFF).
Source: Toronto Treed Area + Ravine + Waterbodies + Street Tree Inventory
Enclosure / Eyes on Park
149 buildings within 25 m of the park edge (14 mid-rise, 135 low-rise, 0 tower); avg edge height 6.8 m (~2 floors); 22.4 buildings per 100 m of 665 m perimeter (strong frontage density); edges are low-rise (mostly 2 to 3 floors); no towers immediately adjacent. "Eyes on the park" come strongest from the 14 mid-rise edge buildings.
Source: Toronto 3D Massing (building footprints + heights)
Border Vacuum Risk
Park edges face the city. No significant border vacuum detected.
Source: Toronto Street Centreline (highways) + rail layer + OSM landuse + building footprints
Equity Context
Equity Context requires inputs not yet loaded for this park (Toronto Neighbourhood Profiles). Score is held at a neutral 50 with low confidence. Read with caution.
Source: Toronto Neighbourhood Profiles
Amenities (2 types · 2 records)
- playground
- sports field
Nearby active-edge features (56)
- parking lot56 m
- transit stop: Robbins Avenue61 m
- transit stop: Robbins Avenue78 m
- retail: Butler's Repair Service96 m
- parking lot99 m
- retail: My Dollar Shop99 m
- restaurant: Godspeed Brewery101 m
- cafe: CAFE Dispensary103 m
- transit stop: Gerrard Street East103 m
- transit stop: Eastwood Road112 m
- retail: Super Dave Convenience122 m
- cafe: Lazy Daisy's128 m
- retail: Sanagan's Meat Locker - Gerrard India Bazaar130 m
- retail: Jupiter Bakehouse132 m
- parking lot134 m
- retail: Bhatti Jewellers135 m
- transit stop: Coxwell Ave at Dundas St E136 m
- transit stop: Coxwell Avenue138 m
- retail: Nawaz Jewellers139 m
- retail: H&H Dry Cleaners139 m
- parking lot139 m
- retail: 22K Gold Jewellers140 m
- restaurant: Harry's Charbroiled141 m
- restaurant: Occassions147 m
- retail: Public Mobile147 m
- retail: Stop 55148 m
- retail: New Town Family Restaurant149 m
- retail: Home Hardware151 m
- retail: Lucky Hair Salon151 m
- retail: Furballs153 m
- retail: Appliances 220154 m
- retail: Birch & Co157 m
- restaurant: Toto Sushi157 m
- retail: ULA Hair Salon157 m
- transit stop: Gerrard Street East161 m
- restaurant: BIRDIES Fried Chicken161 m
- retail: Amman's161 m
- retail: Coxwell Variety162 m
- transit stop: Gerrard Street East164 m
- retail: Angela's Beauty Parlor165 m
- retail: B.K. Natural Foods166 m
- restaurant: British Style Fish and Chips167 m
- retail: Wilson Shoes168 m
- retail: National Convenience171 m
- restaurant: Subway171 m
- retail: The Little Bangladesh172 m
- transit stop: Coxwell Ave at Dundas St E173 m
- retail: Mexicannabis174 m
- parking lot179 m
- cafe: Gallery Coffee Bakery180 m
- cafe: Black Pony180 m
- retail: Apollo Beauty Salon185 m
- retail: SVA189 m
- retail: Sajawat194 m
- restaurant: Siddhartha - Pure Vegetarian197 m
- parking lot199 m
Park profile
Five-axis radar across the structural dimensions.
Citywide percentile ranks
Across all Toronto parks in the dataset.
- Overall vitality94th
- Edge activation80th
- Connectivity60th
- Amenity diversity90th
- Natural comfort82th
- Enclosure81th
Most similar parks
Closest in metric space across the five structural dimensions.
- Stonehouse ParkNeighbourhood Park47
- Chestnut Hills ParkParkette45
- Wishing Well WoodsRavine / Naturalized Park47
- BOWMORE PUBLIC SCHOOL - Building GroundsNeighbourhood Park46
- Yorkwoods ParkUrban Plaza48
Most opposite parks
Furthest in metric space. Useful for recognising what kind of park this isn’t.
- Rouge ParkRavine / Naturalized Park18
- Trca Lands ( 58)Waterfront Park18
- Rouge ParkRavine / Naturalized Park21
- Toronto Islands - Muggs Island ParkRavine / Naturalized Park25
- Rouge ParkWaterfront Park25
Visitor signals
Public attention measured by Google Places aggregates. This proxies attention, not occupancy. Aggregate-only: no usernames, no review text, no extra photos beyond the cached hero.
p60 citywide · p67 within Neighbourhood Park
Source: Google Places API · match high (0.81 composite confidence) · last refreshed 5/9/2026. Privacy contract. Measures public attention, not occupancy.
Human activity signals: not available
No activity signals have landed for this park yet. The model has scored its physical form but it can’t yet say how often it’s programmed, photographed, or walked through. See /data-ethics for what we will and will not collect.
Does this score feel accurate?
Your read of Moncur Playgroundmatters. We’re testing whether the model lines up with how people actually use the park. Submissions are stored locally; no account needed.
Tell us how this park feels
We measure structure (canopy, edges, connectivity). You measure feeling. Both matter, and disagreement is itself useful civic data.
What would improve this park?
Generated from the weakest measured dimensions: a starting point, not a prescription.
- Activate the edges: encourage cafés, retail or community uses on the streets that face the park; replace blank or parking-lot edges where possible.
- Diversify what people can do in the park (playground, washroom, water, shade, performance, sport, garden): even small additions raise this score.
Data sources
- City of Toronto Open Data: Parks (Green Space)Polygon boundaries, official names, types.
- Parks & Recreation FacilitiesInventory of in-park amenities (washrooms, fields, rinks…).
- Toronto Pedestrian NetworkSidewalk segments around and through parks; estimated park entrances.
- Toronto Centreline V2Street segments + intersection nodes near park edges; trails and walkways.
- Toronto 3D MassingBuilding footprints + heights for edge-building counts, frontage density, and tower-in-the-park risk.
- Toronto Treed AreaTree canopy share inside park polygons via stratified-grid sampling.
- Toronto Waterbodies & RiversWater surface inside parks + nearest-water distance for cooling.
- Ravine & Natural Feature ProtectionRavine overlap as a cooling / natural-comfort signal.
- Toronto Street Tree InventoryTree count + density inside park polygons.
- Neighbourhood Profiles(Pending) Equity context proxy.
- OpenStreetMap (Overpass API)Cafés, restaurants, retail, transit stops, parking, highways, rail.