Humber Arboretum
Waterfront Park, middle of the pack overall (score 37, rank ~62th percentile). Strongest: connectivity; weakest: edge activation.
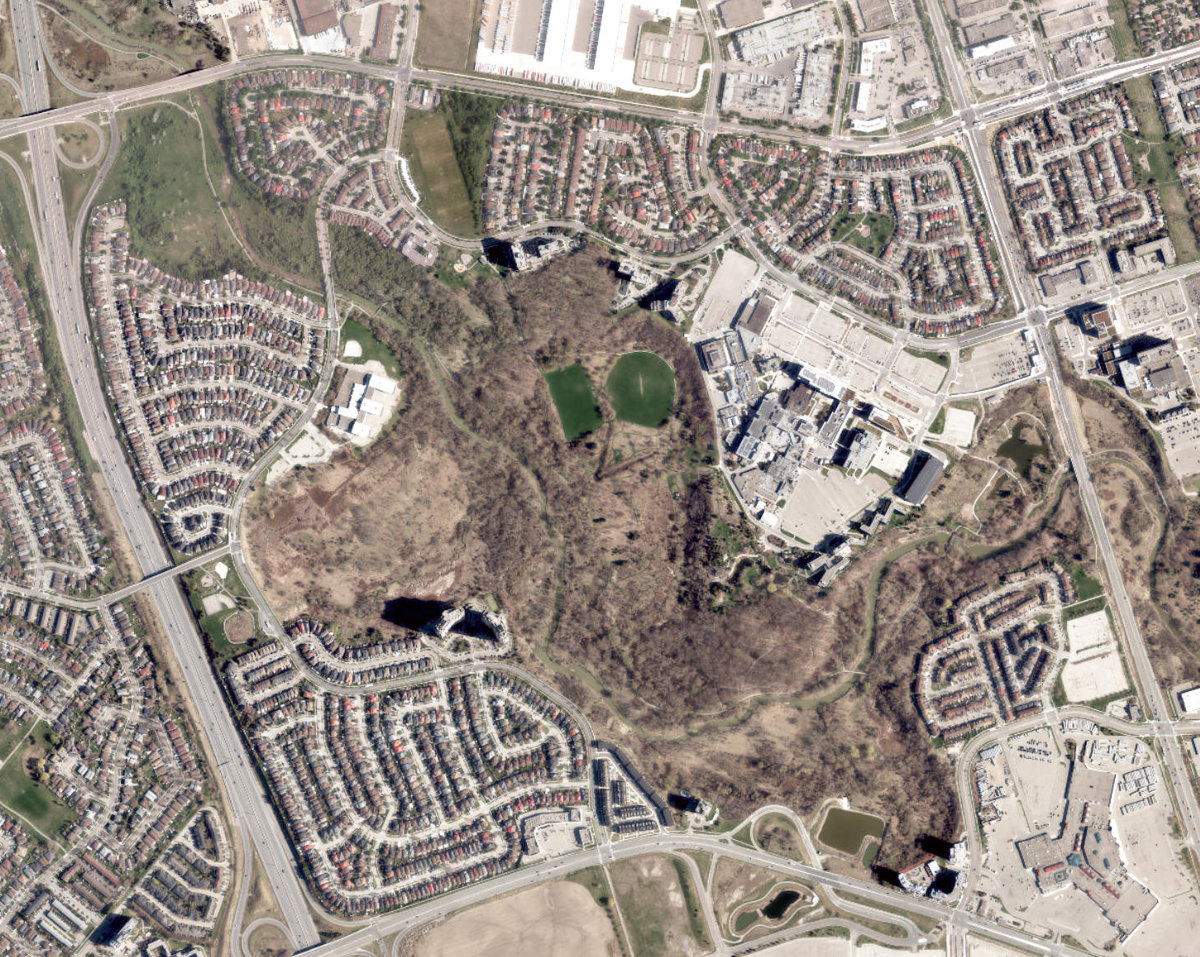
Aerial, City of Toronto orthophoto, ~8 cm/px source · cached 5/9/2026
Humber Arboretum scores 36.7 / 100. Strongest dimensions: connectivity and natural comfort. Weakest: edge activation (0). Border-vacuum risk is elevated (100). This score is a transparent reading of Jane Jacobs-style vitality factors, not a definitive judgment.
Area · 98.28 ha
Weighted across six dimensions · confidence 72%
Scores are not bell-curved. Percentiles and expected scores provide context without changing the underlying model.
Loading map…
The parks map is loading.Explain this score
Where did the 37 come from? Each weighted contribution against a neutral 50 baseline. Green = pushed up; red = pulled down.
Sum of contributions = the headline score. A negative bar means that dimension dragged the park below the city-wide neutral baseline.
Why this park works
Humber Arboretum works because its connectivity score (76) is one of the city's strongest and its natural comfort (74) is also top quartile (79 transit stops sit within a 400 m walk; 44 intersections fall within 100 m of the edge).
What limits this park
Humber Arboretum's edges are fronted by border-vacuum land uses (highways, rail, parking, blank institutional), risk score 100.
Most distinctive characteristic
Most distinctive feature: exceptionally high connectivity (76, top decile).
Jacobs reading
Humber Arboretum sits between an urban social park and an ecological retreat: moderately useful for both, exceptionally suited to neither.
Tradeoffs
- The park is enclosed by buildings (65) but the surrounding streets are quiet (edge activation 0): frame without animation.
- High connectivity coexists with high border-vacuum risk (100): much of that connectivity is to highways, rail, or parking lots, not to neighbourhoods.
Typology classification
Classified as Waterfront Park: 6% water surface inside park. Secondary read: Ravine / Naturalized Park (100% ravine overlap, 35% canopy).
Edge Activation
Within 100 m of the park edge: 14 active uses (transit_stop, community, restaurant) and 30 dead/hostile uses (parking_lot, highway, rail). Active edges keep "eyes on the park" through the day; parking lots, blank institutional walls, rail and highway frontages drain street life.
Source: OSM POIs (amenity/shop) + Toronto Building Footprints + land use
Connectivity
Connectivity blends paths, intersections, transit, entrances, and edge density. This park has 59 mapped paths/walkways and 132 sidewalk segments within 50 m; 44 street intersections within 100 m; 79 transit stops within a 400 m walk; 28 estimated access points across ~9,125 m of perimeter. low edge density, significant superblock penalty applied. Source coverage: centreline, pedestrian_network, transit_osm.
Source: Toronto Centreline V2 + Pedestrian Network + OSM transit stops
Amenity Diversity
2 distinct amenity types in the park (fitness, sports_field). Diversity, not raw count, drives the score so a park with many distinct activity types can outrank a larger park that repeats the same use.
Source: Toronto Parks & Recreation Facilities + OSM amenity tags
Natural Comfort
Natural-comfort components for this park: 34.6% estimated tree canopy; 100.0% inside the ravine system; 6.4% water surface; 30 city-mapped trees inside the polygon (0.3/ha). Reading: ravine-cooled. Source coverage: treed_area, ravine, waterbodies, street_trees. Impervious surface is approximated (Toronto's authoritative layer ships only as a raster GeoTIFF).
Source: Toronto Treed Area + Ravine + Waterbodies + Street Tree Inventory
Enclosure / Eyes on Park
363 buildings within 25 m of the park edge (41 mid-rise, 313 low-rise, 9 tower); avg edge height 7.9 m (~3 floors); 4.0 buildings per 100 m of 9,125 m perimeter (strong frontage density); edges are low-rise (mostly 2 to 3 floors); 9 towers ≥ 40 m within 25 m of the edge. "Eyes on the park" come strongest from the 41 mid-rise edge buildings.
Source: Toronto 3D Massing (building footprints + heights)
Border Vacuum Risk
Border-vacuum factors within 50 m of the park: parking_lot, parking_lot, parking_lot, parking_lot, parking_lot, parking_lot, parking_lot, Highway 27, Highway 27, Highway 27, Lot 4, Lot 15, Highway 27, Lot 2, Line 6 Finch West, Line 6 Finch West, Highway 27. Jacobs warned that highways, rail, parking lots and blank institutional edges act as "vacuums" that suppress foot traffic and isolate the park from its neighbourhood.
Source: Toronto Street Centreline (highways) + rail layer + OSM landuse + building footprints
Equity Context
Equity Context requires inputs not yet loaded for this park (Toronto Neighbourhood Profiles). Score is held at a neutral 50 with low confidence. Read with caution.
Source: Toronto Neighbourhood Profiles
Amenities (2 types · 2 records)
- fitness
- sports field
Nearby active-edge features (80)
- transit stop: Humberwood Blvd at Topbank Dr7 m
- parking lot: Lot 1517 m
- parking lot18 m
- rail: Line 6 Finch West23 m
- transit stop: Humberwood Blvd at Topbank Dr25 m
- parking lot29 m
- parking lot31 m
- highway: Highway 2733 m
- transit stop: Morning Star Drive34 m
- highway: Highway 2736 m
- highway: Highway 2739 m
- parking lot: Lot 240 m
- rail: Line 6 Finch West42 m
- transit stop43 m
- parking lot44 m
- parking lot44 m
- parking lot45 m
- parking lot46 m
- highway: Highway 2746 m
- transit stop: Morning Star Drive48 m
- parking lot: Lot 449 m
- highway: Highway 2750 m
- transit stop: Humber College51 m
- parking lot55 m
- parking lot57 m
- parking lot59 m
- parking lot59 m
- parking lot59 m
- restaurant: Cafe LinX61 m
- parking lot63 m
- parking lot69 m
- highway: Highway 2770 m
- community: Toronto Public Library - Humberwood75 m
- parking lot: Lot 579 m
- parking lot: Lot 1480 m
- highway: Highway 2784 m
- transit stop: Queen's Plate Drive at Rexdale Avenue84 m
- transit stop: Humber College84 m
- parking lot87 m
- transit stop: Humberwood Boulevard Loop88 m
- transit stop: Viewcrest Circle92 m
- restaurant: The Humber Room94 m
- transit stop: Hullrick Drive96 m
- rail: Line 6 Finch West97 m
- transit stop: Hullrick Drive103 m
- transit stop: Viewcrest Circle103 m
- parking lot107 m
- transit stop109 m
- parking lot111 m
- transit stop: Humber College Boulevard / Highway 27114 m
- transit stop: Humber College Boulevard At Highway 27114 m
- highway: Highway 427115 m
- transit stop116 m
- rail: Line 6 Finch West116 m
- parking lot119 m
- parking lot120 m
- transit stop: Queen's Plate Drive at Rexdale Boulevard122 m
- parking lot: Lot 3122 m
- transit stop: Humberwood Boulevard at Pinecone Drive North Side122 m
- transit stop124 m
- cafe: Tim Hortons125 m
- transit stop: Queen's Plate Drive at Triple Crown Avenue128 m
- highway: Highway 27128 m
- transit stop: Queen's Plate Dr at Rexdale Blvd128 m
- highway: Highway 27131 m
- transit stop: Humberwood Boulevard at Pinecone Drive131 m
- transit stop: Holyoake Crescent132 m
- parking lot: Lot 1133 m
- transit stop: Rexdale Boulevard At Woodbine Centre134 m
- parking lot: Lot 13135 m
- transit stop: Rexdale Boulevard At Humberwood Boulevard138 m
- parking lot140 m
- transit stop: Humberwood Boulevard141 m
- transit stop: Humber College Boulevard at Highway 27141 m
- parking lot: Lot 11142 m
- transit stop: Humberwood Boulevard at Honeyview Place142 m
- parking lot144 m
- highway: Highway 427145 m
- transit stop: Humber College Bus Terminal Platform 4146 m
- transit stop: Woodbine Centre Bus Terminal Platform A146 m
Park profile
Five-axis radar across the structural dimensions.
Citywide percentile ranks
Across all Toronto parks in the dataset.
- Overall vitality62th
- Edge activation44th
- Connectivity96th
- Amenity diversity86th
- Natural comfort87th
- Enclosure58th
Most similar parks
Closest in metric space across the five structural dimensions.
- Downsview Dells ParkRavine / Naturalized Park36
- Birkdale RavineWaterfront Park40
- Cruickshank ParkWaterfront Park38
- Home Smith ParkRavine / Naturalized Park43
- West Humber ParklandWaterfront Park36
Most opposite parks
Furthest in metric space. Useful for recognising what kind of park this isn’t.
- Joseph Burr Tyrrell ParkUrban Plaza50
- Queen'S Quay Traffic IslandWaterfront Park49
- Bernard Avenue Road AllowanceUrban Plaza54
- ALEX WILSON COMMUNITY GARDEN - Open Green SpaceUrban Plaza59
- Danforth Gardens ParkParkette42
Human activity signals: not available
No activity signals have landed for this park yet. The model has scored its physical form but it can’t yet say how often it’s programmed, photographed, or walked through. See /data-ethics for what we will and will not collect.
Does this score feel accurate?
Your read of Humber Arboretummatters. We’re testing whether the model lines up with how people actually use the park. Submissions are stored locally; no account needed.
Tell us how this park feels
We measure structure (canopy, edges, connectivity). You measure feeling. Both matter, and disagreement is itself useful civic data.
What would improve this park?
Generated from the weakest measured dimensions: a starting point, not a prescription.
- Activate the edges: encourage cafés, retail or community uses on the streets that face the park; replace blank or parking-lot edges where possible.
- Diversify what people can do in the park (playground, washroom, water, shade, performance, sport, garden): even small additions raise this score.
- Mitigate border vacuums (highways, rail, parking) with active programming on the still-permeable edges and treat the hostile edge as a design challenge.
Data sources
- City of Toronto Open Data: Parks (Green Space)Polygon boundaries, official names, types.
- Parks & Recreation FacilitiesInventory of in-park amenities (washrooms, fields, rinks…).
- Toronto Pedestrian NetworkSidewalk segments around and through parks; estimated park entrances.
- Toronto Centreline V2Street segments + intersection nodes near park edges; trails and walkways.
- Toronto 3D MassingBuilding footprints + heights for edge-building counts, frontage density, and tower-in-the-park risk.
- Toronto Treed AreaTree canopy share inside park polygons via stratified-grid sampling.
- Toronto Waterbodies & RiversWater surface inside parks + nearest-water distance for cooling.
- Ravine & Natural Feature ProtectionRavine overlap as a cooling / natural-comfort signal.
- Toronto Street Tree InventoryTree count + density inside park polygons.
- Neighbourhood Profiles(Pending) Equity context proxy.
- OpenStreetMap (Overpass API)Cafés, restaurants, retail, transit stops, parking, highways, rail.