Boswell Parkette
Urban Plaza, in the top tier overall (score 48, rank ~93th percentile). Strongest: enclosure; weakest: natural comfort.
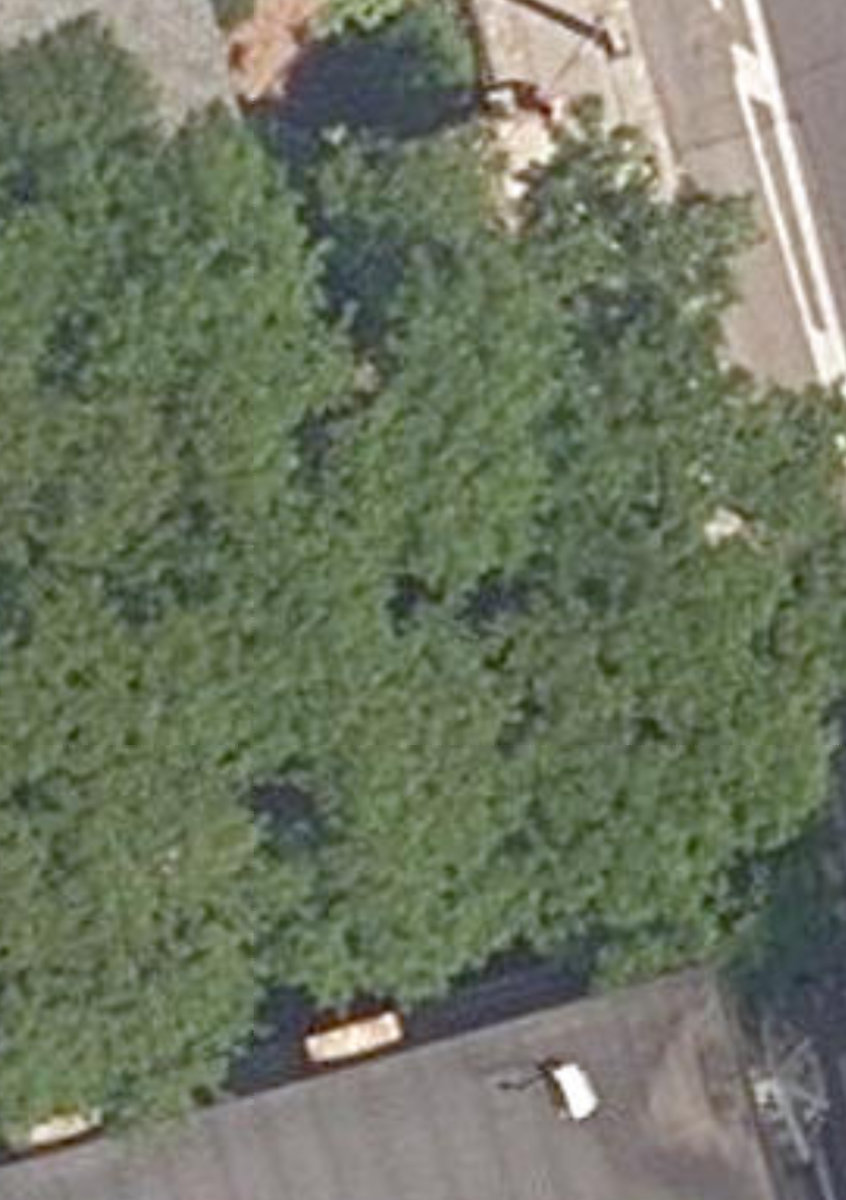
Aerial, City of Toronto orthophoto, ~8 cm/px source · cached 5/9/2026
Boswell Parkette scores 47.6 / 100. Strongest dimensions: enclosure / eyes on park and connectivity. Weakest: amenity diversity (0). Border-vacuum risk is low. This score is a transparent reading of Jane Jacobs-style vitality factors, not a definitive judgment.
Area · 0.01 ha
Weighted across six dimensions · confidence 56%
Scores are not bell-curved. Percentiles and expected scores provide context without changing the underlying model.
Loading map…
The parks map is loading.Explain this score
Where did the 48 come from? Each weighted contribution against a neutral 50 baseline. Green = pushed up; red = pulled down.
Sum of contributions = the headline score. A negative bar means that dimension dragged the park below the city-wide neutral baseline.
Why this park works
Boswell Parkette works because its enclosure score (97) is one of the city's strongest and its edge activation (52) is also top decile (27 mid-rise buildings frame the edge with passive surveillance).
What limits this park
Boswell Parkette is held back by natural comfort (22, bottom quartile): only 0% canopy means little summer shade.
Most distinctive characteristic
Most distinctive feature: exceptionally low natural comfort (22, bottom quartile).
Jacobs reading
Boswell Parkette sits between an urban social park and an ecological retreat: moderately useful for both, exceptionally suited to neither.
Tradeoffs
- Connectivity (58) significantly outpaces natural comfort (22): well placed in the city but offers little shade or ecological respite.
Performance in context
- A modest overperformer for its urban plaza typology (+11 vs the median in pocket Urban Plaza).
Typology classification
Classified as Urban Plaza: 132 m², paved (0% canopy), 44.0 buildings/100 m
Edge Activation
Within 100 m of the park edge: 9 active uses (retail, transit_stop, restaurant) and 1 dead/hostile uses (parking_lot). Active edges keep "eyes on the park" through the day; parking lots, blank institutional walls, rail and highway frontages drain street life.
Source: OSM POIs (amenity/shop) + Toronto Building Footprints + land use
Connectivity
Connectivity blends paths, intersections, transit, entrances, and edge density. This park has 2 mapped paths/walkways and 7 sidewalk segments within 50 m; 5 street intersections within 100 m; 22 transit stops within a 400 m walk; 1 estimated access points across ~48 m of perimeter. edge density is healthy, no superblock penalty. Source coverage: centreline, pedestrian_network, transit_osm.
Source: Toronto Centreline V2 + Pedestrian Network + OSM transit stops
Amenity Diversity
No amenities recorded. Score is 0 until inventory is loaded.
Source: Toronto Parks & Recreation Facilities + OSM amenity tags
Natural Comfort
Natural-comfort components for this park: 0.0% estimated tree canopy; nearest waterbody ~1478 m. Reading: exposed. Source coverage: waterbodies. Impervious surface is approximated (Toronto's authoritative layer ships only as a raster GeoTIFF).
Source: Toronto Treed Area + Ravine + Waterbodies + Street Tree Inventory
Enclosure / Eyes on Park
44 buildings within 25 m of the park edge (27 mid-rise, 17 low-rise, 0 tower); avg edge height 12.6 m (~4 floors); 44.0 buildings per 100 m of 48 m perimeter (strong frontage density); edges are at a Jacobs-scale walkable mid-rise (3 to 7 floors); no towers immediately adjacent. "Eyes on the park" come strongest from the 27 mid-rise edge buildings.
Source: Toronto 3D Massing (building footprints + heights)
Border Vacuum Risk
Park edges face the city. No significant border vacuum detected.
Source: Toronto Street Centreline (highways) + rail layer + OSM landuse + building footprints
Equity Context
Equity Context requires inputs not yet loaded for this park (Toronto Neighbourhood Profiles). Score is held at a neutral 50 with low confidence. Read with caution.
Source: Toronto Neighbourhood Profiles
Amenities (0)
No amenities recorded for this park.
Nearby active-edge features (31)
- transit stop: Avenue Rd at Boswell Ave1 m
- retail: Henri Coiffures22 m
- transit stop: Avenue Rd at Boswell Ave24 m
- restaurant: Zin Restaurant35 m
- retail: Louro & Sons Jewellers35 m
- retail: Ferrari Maserati of Toronto41 m
- retail: DLK On Avenue51 m
- retail: Structube63 m
- retail: Whole Foods Market81 m
- parking lot92 m
- parking lot103 m
- retail: Dove Cleaners113 m
- parking lot114 m
- retail: Sotto Sotto116 m
- cafe: Seven Grains Expresso Bar121 m
- retail: Selba Kitchens & Baths123 m
- retail: Orya Beauty Boutique129 m
- restaurant: Dyne129 m
- retail: Novo Spa133 m
- retail: John Paul & Co.134 m
- retail: Leonardo Galleries137 m
- retail: Galerie de Bellefeuille137 m
- retail: Palais Royale House & Home144 m
- transit stop: Avenue Rd at Lowther Ave North Side158 m
- retail: Grower's Flower Market & Gifts163 m
- retail: Grower's Flower Market & Gifts172 m
- retail: Jong Young Food & Flower Market177 m
- retail: Blanco Plus183 m
- retail: Yang's Flower Mart189 m
- restaurant: Osteria Giulia196 m
- retail: Rogers200 m
Park profile
Five-axis radar across the structural dimensions.
Citywide percentile ranks
Across all Toronto parks in the dataset.
- Overall vitality93th
- Edge activation96th
- Connectivity70th
- Amenity diversity50th
- Natural comfort0th
- Enclosure100th
Most similar parks
Closest in metric space across the five structural dimensions.
- City Wide Open SpaceUrban Plaza47
- Roxborough - Yonge St Traffic IslandUrban Plaza43
- QUEEN STREET PRESBYTERIAN CHURCH GROUNDS - Building GroundsUrban Plaza44
- Dane ParketteUrban Plaza42
- Glasgow Street ParketteUrban Plaza50
Most opposite parks
Furthest in metric space. Useful for recognising what kind of park this isn’t.
- Trca Lands ( 26)Ravine / Naturalized Park27
- Toronto Islands - Muggs Island ParkRavine / Naturalized Park25
- Rouge ParkRavine / Naturalized Park28
- Rouge ParkWaterfront Park25
- Rouge ParkRavine / Naturalized Park26
Human activity signals: not available
No activity signals have landed for this park yet. The model has scored its physical form but it can’t yet say how often it’s programmed, photographed, or walked through. See /data-ethics for what we will and will not collect.
Does this score feel accurate?
Your read of Boswell Parkettematters. We’re testing whether the model lines up with how people actually use the park. Submissions are stored locally; no account needed.
Tell us how this park feels
We measure structure (canopy, edges, connectivity). You measure feeling. Both matter, and disagreement is itself useful civic data.
What would improve this park?
Generated from the weakest measured dimensions: a starting point, not a prescription.
- Diversify what people can do in the park (playground, washroom, water, shade, performance, sport, garden): even small additions raise this score.
- Increase canopy and reduce paved area. Shade and water features extend usable hours and seasons.
Data sources
- City of Toronto Open Data: Parks (Green Space)Polygon boundaries, official names, types.
- Parks & Recreation FacilitiesInventory of in-park amenities (washrooms, fields, rinks…).
- Toronto Pedestrian NetworkSidewalk segments around and through parks; estimated park entrances.
- Toronto Centreline V2Street segments + intersection nodes near park edges; trails and walkways.
- Toronto 3D MassingBuilding footprints + heights for edge-building counts, frontage density, and tower-in-the-park risk.
- Toronto Treed AreaTree canopy share inside park polygons via stratified-grid sampling.
- Toronto Waterbodies & RiversWater surface inside parks + nearest-water distance for cooling.
- Ravine & Natural Feature ProtectionRavine overlap as a cooling / natural-comfort signal.
- Toronto Street Tree InventoryTree count + density inside park polygons.
- Neighbourhood Profiles(Pending) Equity context proxy.
- OpenStreetMap (Overpass API)Cafés, restaurants, retail, transit stops, parking, highways, rail.