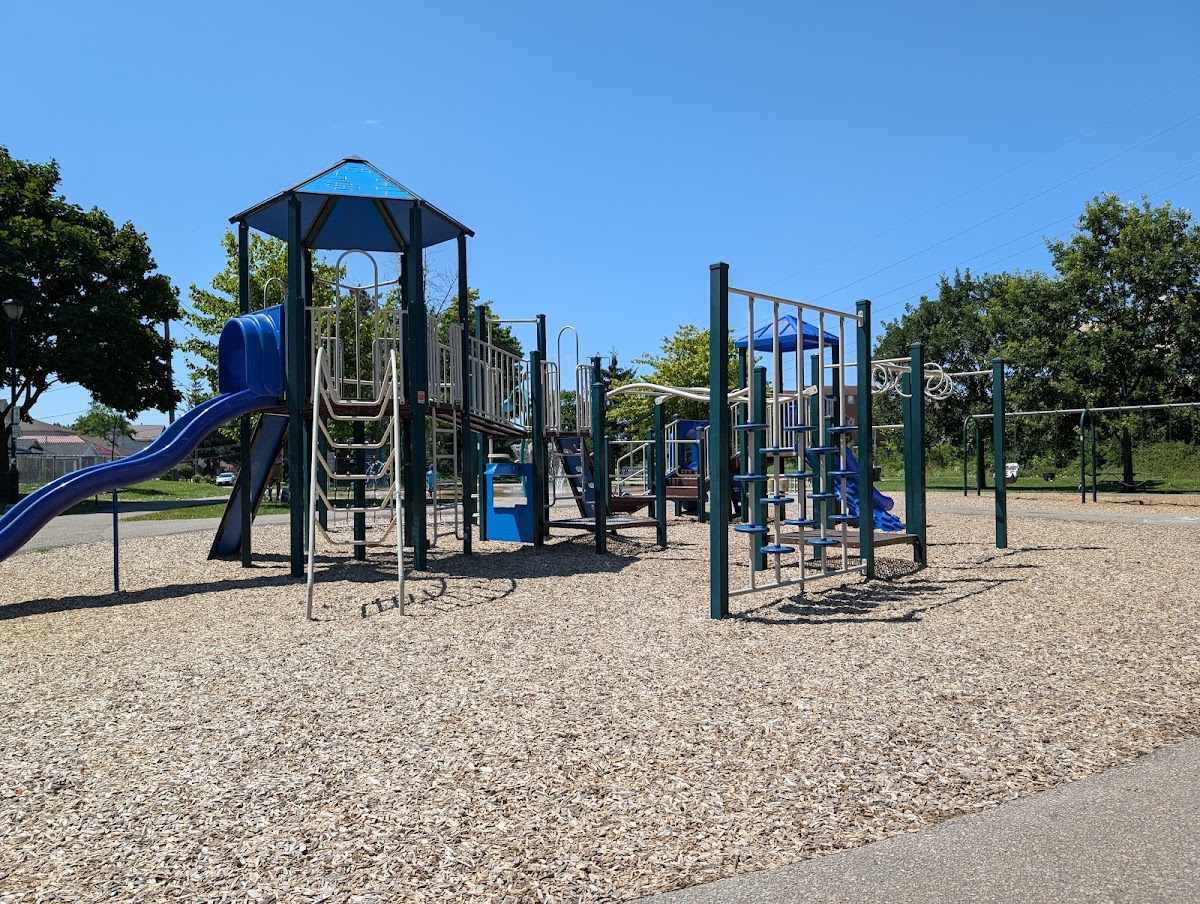
Walter Saunders Memorial Park
Civic Square, in the top tier overall (score 44, rank ~86th percentile). Strongest: connectivity; weakest: edge activation.
Photo by Steven Sample via Google Places · cached 5/9/2026
Walter Saunders Memorial Park scores 43.6 / 100. Strongest dimensions: connectivity and enclosure / eyes on park. Weakest: edge activation (0). Border-vacuum risk is elevated (36). This score is a transparent reading of Jane Jacobs-style vitality factors, not a definitive judgment.
Area · 1.37 ha
Weighted across six dimensions · confidence 66%
Scores are not bell-curved. Percentiles and expected scores provide context without changing the underlying model.
Loading map…
The parks map is loading.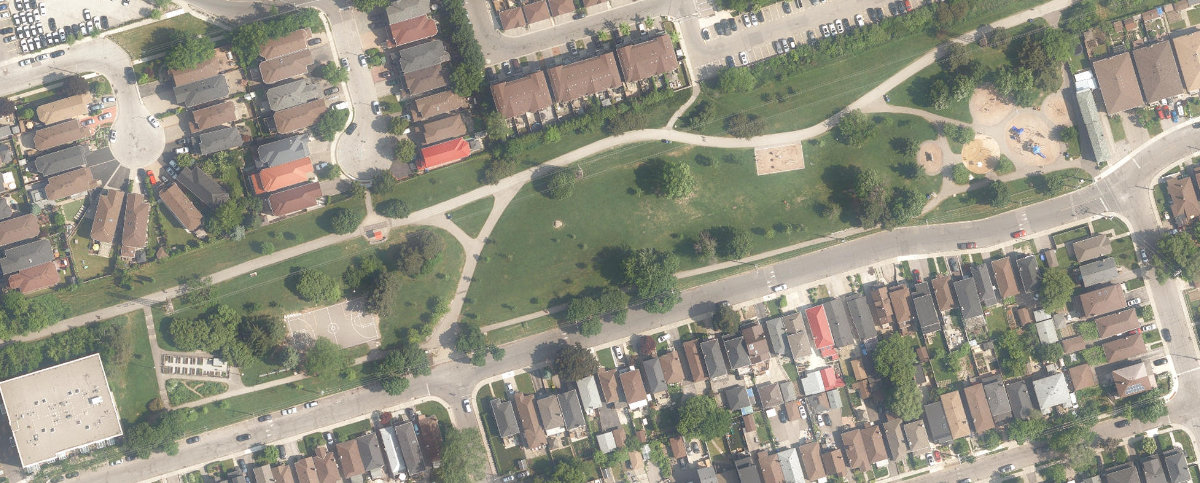
Explain this score
Where did the 44 come from? Each weighted contribution against a neutral 50 baseline. Green = pushed up; red = pulled down.
Sum of contributions = the headline score. A negative bar means that dimension dragged the park below the city-wide neutral baseline.
Why this park works
Walter Saunders Memorial Park works because its connectivity score (81) is one of the city's strongest and its amenity diversity (27) is also top decile (24 transit stops sit within a 400 m walk; 13 intersections fall within 100 m of the edge).
What limits this park
Walter Saunders Memorial Park's edges are fronted by border-vacuum land uses (highways, rail, parking, blank institutional), risk score 36.
Most distinctive characteristic
Most distinctive feature: exceptionally high connectivity (81, top decile).
Jacobs reading
Walter Saunders Memorial Park sits between an urban social park and an ecological retreat: moderately useful for both, exceptionally suited to neither.
Tradeoffs
- The park is enclosed by buildings (71) but the surrounding streets are quiet (edge activation 0): frame without animation.
Typology classification
Classified as Civic Square: name flags as civic square + 175 buildings frame the edge. Secondary read: Neighbourhood Park (1.4 ha, framed by 6 mid-rise vs 0 towers).
Edge Activation
Within 100 m of the park edge: 0 active uses (none) and 6 dead/hostile uses (parking_lot). Active edges keep "eyes on the park" through the day; parking lots, blank institutional walls, rail and highway frontages drain street life.
Source: OSM POIs (amenity/shop) + Toronto Building Footprints + land use
Connectivity
Connectivity blends paths, intersections, transit, entrances, and edge density. This park has 55 mapped paths/walkways and 40 sidewalk segments within 50 m; 13 street intersections within 100 m; 24 transit stops within a 400 m walk; 21 estimated access points across ~792 m of perimeter. moderate edge density, small superblock penalty applied. Source coverage: centreline, pedestrian_network, transit_osm.
Source: Toronto Centreline V2 + Pedestrian Network + OSM transit stops
Amenity Diversity
3 distinct amenity types in the park (basketball, fitness, playground). Diversity, not raw count, drives the score so a park with many distinct activity types can outrank a larger park that repeats the same use.
Source: Toronto Parks & Recreation Facilities + OSM amenity tags
Natural Comfort
Natural-comfort components for this park: ~33.2% effective canopy (0.0% from contiguous tree polygons + scattered tree density); 65 city-mapped trees inside the polygon (47.4/ha). Reading: partially shaded. Source coverage: street_trees. Impervious surface is approximated (Toronto's authoritative layer ships only as a raster GeoTIFF).
Source: Toronto Treed Area + Ravine + Waterbodies + Street Tree Inventory
Enclosure / Eyes on Park
175 buildings within 25 m of the park edge (6 mid-rise, 169 low-rise, 0 tower); avg edge height 5.8 m (~2 floors); 22.1 buildings per 100 m of 792 m perimeter (strong frontage density); edges are barely there or single-storey; no towers immediately adjacent. "Eyes on the park" come strongest from the 6 mid-rise edge buildings.
Source: Toronto 3D Massing (building footprints + heights)
Border Vacuum Risk
Border-vacuum factors within 50 m of the park: parking_lot, parking_lot, parking_lot. Jacobs warned that highways, rail, parking lots and blank institutional edges act as "vacuums" that suppress foot traffic and isolate the park from its neighbourhood.
Source: Toronto Street Centreline (highways) + rail layer + OSM landuse + building footprints
Equity Context
Equity Context requires inputs not yet loaded for this park (Toronto Neighbourhood Profiles). Score is held at a neutral 50 with low confidence. Read with caution.
Source: Toronto Neighbourhood Profiles
Amenities (3 types · 3 records)
- basketball
- fitness
- playground
Nearby active-edge features (34)
- parking lot34 m
- parking lot38 m
- parking lot44 m
- parking lot58 m
- parking lot70 m
- parking lot77 m
- parking lot138 m
- retail: Michelle's Beauty Supply145 m
- parking lot146 m
- retail: King Appliances147 m
- transit stop: Dufferin St at Bowie Ave148 m
- restaurant: Yum Yum Restaurant149 m
- retail: The Nail Place151 m
- retail: Adventure Cycle151 m
- retail: Hair Play Salon155 m
- parking lot155 m
- restaurant: Ocean Grill Restaurant158 m
- restaurant: Express Thai Cuisine160 m
- parking lot161 m
- restaurant: Delicious Empanadas163 m
- parking lot163 m
- parking lot164 m
- transit stop: Whitmore Avenue167 m
- retail: Paris Nails169 m
- retail: Pet Valu171 m
- parking lot171 m
- retail: Vari Coffee Deli & Variety Store172 m
- parking lot178 m
- retail: LCBO181 m
- parking lot182 m
- transit stop: Castlefield Avenue183 m
- restaurant: California Sandwiches197 m
- parking lot198 m
- parking lot199 m
Park profile
Five-axis radar across the structural dimensions.
Citywide percentile ranks
Across all Toronto parks in the dataset.
- Overall vitality86th
- Edge activation42th
- Connectivity99th
- Amenity diversity92th
- Natural comfort70th
- Enclosure70th
Most similar parks
Closest in metric space across the five structural dimensions.
- Taylor Creek ParkWaterfront Park35
- Eglinton FlatsWaterfront Park35
- Riverdale Park WestRavine / Naturalized Park46
- East Mall ParkNeighbourhood Park42
- Port Union Village Common ParkCorridor / Linear Park39
Most opposite parks
Furthest in metric space. Useful for recognising what kind of park this isn’t.
- Simcoe ParkTower-Community Green Space51
- Joseph Burr Tyrrell ParkUrban Plaza50
- Queen'S Quay Traffic IslandWaterfront Park49
- Toronto Islands - Muggs Island ParkRavine / Naturalized Park25
- Trca Lands ( 26)Ravine / Naturalized Park27
Visitor signals
Public attention measured by Google Places aggregates. This proxies attention, not occupancy. Aggregate-only: no usernames, no review text, no extra photos beyond the cached hero.
p77 citywide · p38 within Civic Square
Source: Google Places API · match high (0.96 composite confidence) · last refreshed 5/9/2026. Privacy contract. Measures public attention, not occupancy.
Human activity signals: not available
No activity signals have landed for this park yet. The model has scored its physical form but it can’t yet say how often it’s programmed, photographed, or walked through. See /data-ethics for what we will and will not collect.
Does this score feel accurate?
Your read of Walter Saunders Memorial Parkmatters. We’re testing whether the model lines up with how people actually use the park. Submissions are stored locally; no account needed.
Tell us how this park feels
We measure structure (canopy, edges, connectivity). You measure feeling. Both matter, and disagreement is itself useful civic data.
What would improve this park?
Generated from the weakest measured dimensions: a starting point, not a prescription.
- Activate the edges: encourage cafés, retail or community uses on the streets that face the park; replace blank or parking-lot edges where possible.
- Diversify what people can do in the park (playground, washroom, water, shade, performance, sport, garden): even small additions raise this score.
- Mitigate border vacuums (highways, rail, parking) with active programming on the still-permeable edges and treat the hostile edge as a design challenge.
Data sources
- City of Toronto Open Data: Parks (Green Space)Polygon boundaries, official names, types.
- Parks & Recreation FacilitiesInventory of in-park amenities (washrooms, fields, rinks…).
- Toronto Pedestrian NetworkSidewalk segments around and through parks; estimated park entrances.
- Toronto Centreline V2Street segments + intersection nodes near park edges; trails and walkways.
- Toronto 3D MassingBuilding footprints + heights for edge-building counts, frontage density, and tower-in-the-park risk.
- Toronto Treed AreaTree canopy share inside park polygons via stratified-grid sampling.
- Toronto Waterbodies & RiversWater surface inside parks + nearest-water distance for cooling.
- Ravine & Natural Feature ProtectionRavine overlap as a cooling / natural-comfort signal.
- Toronto Street Tree InventoryTree count + density inside park polygons.
- Neighbourhood Profiles(Pending) Equity context proxy.
- OpenStreetMap (Overpass API)Cafés, restaurants, retail, transit stops, parking, highways, rail.