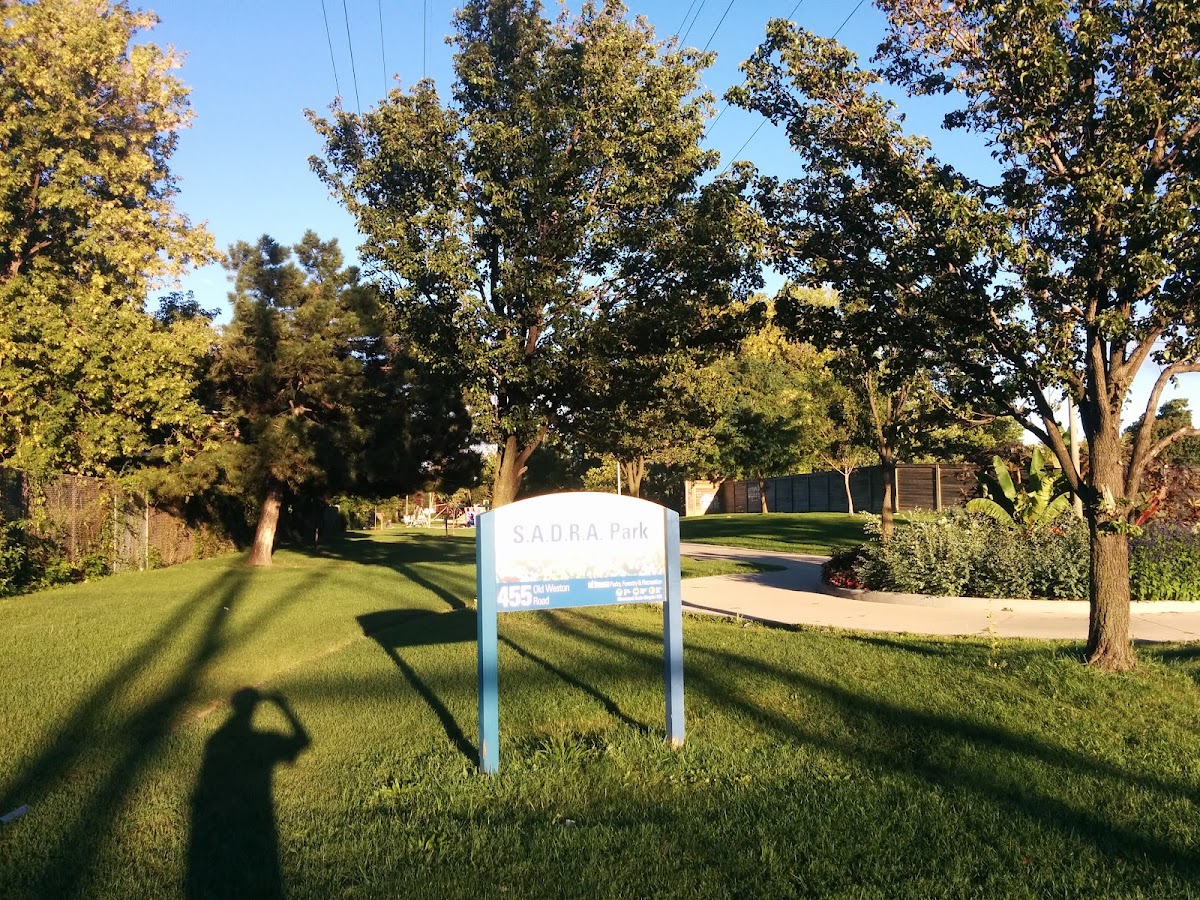
S.A.D.R.A. Park
Corridor / Linear Park, one of the city's strongest overall (score 52, rank ~97th percentile). Strongest: connectivity; weakest: natural comfort.
Photo by Warren Day via Google Places · cached 5/9/2026
S.A.D.R.A. Park scores 51.6 / 100. Strongest dimensions: connectivity and enclosure / eyes on park. Weakest: amenity diversity (19.9). Border-vacuum risk is low. This score is a transparent reading of Jane Jacobs-style vitality factors, not a definitive judgment.
Area · 1.20 ha
Weighted across six dimensions · confidence 68%
Scores are not bell-curved. Percentiles and expected scores provide context without changing the underlying model.
Loading map…
The parks map is loading.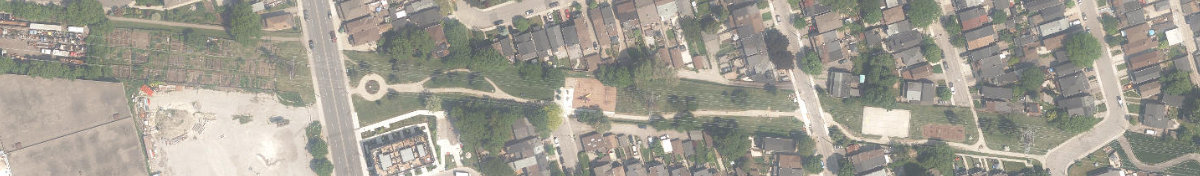
Explain this score
Where did the 52 come from? Each weighted contribution against a neutral 50 baseline. Green = pushed up; red = pulled down.
Sum of contributions = the headline score. A negative bar means that dimension dragged the park below the city-wide neutral baseline.
Why this park works
S.A.D.R.A. Park works because its connectivity score (80) is one of the city's strongest and its edge activation (41) is also top decile (21 transit stops sit within a 400 m walk; 29 intersections fall within 100 m of the edge).
What limits this park
S.A.D.R.A. Park is held back by natural comfort (34, bottom quartile): only 0% canopy means little summer shade.
Most distinctive characteristic
Most distinctive feature: exceptionally high connectivity (80, top decile).
Jacobs reading
S.A.D.R.A. Park sits between an urban social park and an ecological retreat: moderately useful for both, exceptionally suited to neither.
Tradeoffs
- Connectivity (80) significantly outpaces natural comfort (34): well placed in the city but offers little shade or ecological respite.
Performance in context
- This park is a strong overperformer for its cohort: raw 52 versus an expected 37 for similar parks (medium Corridor / Linear Park) (gap +15).
Typology classification
Classified as Corridor / Linear Park: shape elongation 2.8× a circle of equal area. Secondary read: Neighbourhood Park (1.2 ha, framed by 18 mid-rise vs 0 towers).
Edge Activation
Within 100 m of the park edge: 11 active uses (transit_stop, retail, restaurant, cafe) and 3 dead/hostile uses (parking_lot). Active edges keep "eyes on the park" through the day; parking lots, blank institutional walls, rail and highway frontages drain street life.
Source: OSM POIs (amenity/shop) + Toronto Building Footprints + land use
Connectivity
Connectivity blends paths, intersections, transit, entrances, and edge density. This park has 19 mapped paths/walkways and 37 sidewalk segments within 50 m; 29 street intersections within 100 m; 21 transit stops within a 400 m walk; 13 estimated access points across ~1,104 m of perimeter. edge density is healthy, no superblock penalty. Source coverage: centreline, pedestrian_network, transit_osm.
Source: Toronto Centreline V2 + Pedestrian Network + OSM transit stops
Amenity Diversity
2 distinct amenity types in the park (fitness, playground). Diversity, not raw count, drives the score so a park with many distinct activity types can outrank a larger park that repeats the same use.
Source: Toronto Parks & Recreation Facilities + OSM amenity tags
Natural Comfort
Natural-comfort components for this park: ~1.2% effective canopy (0.0% from contiguous tree polygons + scattered tree density); nearest waterbody ~907 m; 2 city-mapped trees inside the polygon (1.7/ha). Reading: exposed. Source coverage: waterbodies, street_trees. Impervious surface is approximated (Toronto's authoritative layer ships only as a raster GeoTIFF).
Source: Toronto Treed Area + Ravine + Waterbodies + Street Tree Inventory
Enclosure / Eyes on Park
301 buildings within 25 m of the park edge (18 mid-rise, 283 low-rise, 0 tower); avg edge height 6.6 m (~2 floors); 27.3 buildings per 100 m of 1,104 m perimeter (strong frontage density); edges are low-rise (mostly 2 to 3 floors); no towers immediately adjacent. "Eyes on the park" come strongest from the 18 mid-rise edge buildings.
Source: Toronto 3D Massing (building footprints + heights)
Border Vacuum Risk
Border-vacuum factors within 50 m of the park: parking_lot. Jacobs warned that highways, rail, parking lots and blank institutional edges act as "vacuums" that suppress foot traffic and isolate the park from its neighbourhood.
Source: Toronto Street Centreline (highways) + rail layer + OSM landuse + building footprints
Equity Context
Equity Context requires inputs not yet loaded for this park (Toronto Neighbourhood Profiles). Score is held at a neutral 50 with low confidence. Read with caution.
Source: Toronto Neighbourhood Profiles
Amenities (2 types · 2 records)
- fitness
- playground
Nearby active-edge features (61)
- parking lot40 m
- transit stop: Old Weston Rd at Rockwell Ave66 m
- restaurant: Marina’s Casa da Comida83 m
- retail: Librarie Mosaique84 m
- restaurant: Sabors Tradicionais85 m
- transit stop: Old Weston Rd at Rockwell Ave85 m
- restaurant: Unique Cafe Restaurant86 m
- restaurant: Sabor Brazil88 m
- retail: Benjamin Moore90 m
- cafe: Aunty Em's Deli & Coffee93 m
- restaurant: Marinho Sports Bar95 m
- parking lot96 m
- retail: Hi-Five Computer97 m
- parking lot100 m
- restaurant: El Rancherito101 m
- parking lot: Carpark 133101 m
- retail: Salon Dionne105 m
- retail: Victoria Dry Cleaners106 m
- transit stop: Laughton107 m
- retail: St. Clair Bakery109 m
- restaurant: Flor do Ave115 m
- retail: Boston Variety117 m
- transit stop: Silverthorn Avenue118 m
- retail120 m
- retail: Calabria Wearing123 m
- retail: Newediuk Funeral Home124 m
- retail: Alli's Fresh Baked125 m
- retail: Lucky Star Flowers125 m
- restaurant: Da Silva Sports Bar & Grill126 m
- restaurant: Samba128 m
- community: Toronto Public Library - St. Clair/Silverthorn130 m
- retail: Bad Buddha Tattoes134 m
- restaurant: Huong Viet Restaurant136 m
- cafe: Lido Caffe136 m
- retail: St. Lucia Variety141 m
- transit stop: Silverthorn Avenue143 m
- retail: Golden Star147 m
- parking lot148 m
- transit stop: Laughton150 m
- retail: Dollar & Variety Store150 m
- restaurant: Pho Xua151 m
- retail: City Nails153 m
- restaurant: Banh Cuon Pho Ga155 m
- restaurant: King's Delight156 m
- transit stop: Townsley Loop at Townsley St157 m
- retail: Sister's Choice158 m
- retail: Sandro's Barber Shop158 m
- restaurant: Tropical Venue159 m
- cafe: Hounslow's House161 m
- retail: West York Appliances & Furniture162 m
- parking lot163 m
- retail: Art Collective CODA165 m
- parking lot179 m
- retail: Pacho’s Convenience179 m
- transit stop: Old Weston Rd at St Clair Ave W181 m
- retail: Popy Furniture188 m
- parking lot190 m
- restaurant: Távora195 m
- restaurant: Pita & Grill198 m
- restaurant: Pizza Pan199 m
- retail200 m
Park profile
Five-axis radar across the structural dimensions.
Citywide percentile ranks
Across all Toronto parks in the dataset.
- Overall vitality97th
- Edge activation93th
- Connectivity99th
- Amenity diversity86th
- Natural comfort17th
- Enclosure79th
Most similar parks
Closest in metric space across the five structural dimensions.
- East Toronto Athletic FieldNeighbourhood Park50
- Susan Tibaldi ParketteUrban Plaza48
- Glen Stewart ParkRavine / Naturalized Park49
- Wenderly ParkNeighbourhood Park52
- Wallace Emerson ParkNeighbourhood Park54
Most opposite parks
Furthest in metric space. Useful for recognising what kind of park this isn’t.
- Trca Lands ( 26)Ravine / Naturalized Park27
- Toronto Islands - Muggs Island ParkRavine / Naturalized Park25
- Rouge ParkRavine / Naturalized Park28
- Rouge ParkRavine / Naturalized Park26
- Rouge ParkWaterfront Park25
Visitor signals
Public attention measured by Google Places aggregates. This proxies attention, not occupancy. Aggregate-only: no usernames, no review text, no extra photos beyond the cached hero.
p44 citywide · p65 within Corridor / Linear Park
Source: Google Places API · match high (0.97 composite confidence) · last refreshed 5/9/2026. Privacy contract. Measures public attention, not occupancy.
Human activity signals: not available
No activity signals have landed for this park yet. The model has scored its physical form but it can’t yet say how often it’s programmed, photographed, or walked through. See /data-ethics for what we will and will not collect.
Does this score feel accurate?
Your read of S.A.D.R.A. Parkmatters. We’re testing whether the model lines up with how people actually use the park. Submissions are stored locally; no account needed.
Tell us how this park feels
We measure structure (canopy, edges, connectivity). You measure feeling. Both matter, and disagreement is itself useful civic data.
What would improve this park?
Generated from the weakest measured dimensions: a starting point, not a prescription.
- Activate the edges: encourage cafés, retail or community uses on the streets that face the park; replace blank or parking-lot edges where possible.
- Diversify what people can do in the park (playground, washroom, water, shade, performance, sport, garden): even small additions raise this score.
- Increase canopy and reduce paved area. Shade and water features extend usable hours and seasons.
Data sources
- City of Toronto Open Data: Parks (Green Space)Polygon boundaries, official names, types.
- Parks & Recreation FacilitiesInventory of in-park amenities (washrooms, fields, rinks…).
- Toronto Pedestrian NetworkSidewalk segments around and through parks; estimated park entrances.
- Toronto Centreline V2Street segments + intersection nodes near park edges; trails and walkways.
- Toronto 3D MassingBuilding footprints + heights for edge-building counts, frontage density, and tower-in-the-park risk.
- Toronto Treed AreaTree canopy share inside park polygons via stratified-grid sampling.
- Toronto Waterbodies & RiversWater surface inside parks + nearest-water distance for cooling.
- Ravine & Natural Feature ProtectionRavine overlap as a cooling / natural-comfort signal.
- Toronto Street Tree InventoryTree count + density inside park polygons.
- Neighbourhood Profiles(Pending) Equity context proxy.
- OpenStreetMap (Overpass API)Cafés, restaurants, retail, transit stops, parking, highways, rail.