Pearen Park
Neighbourhood Park, above average overall (score 40, rank ~77th percentile). Strongest: amenity diversity; weakest: enclosure.
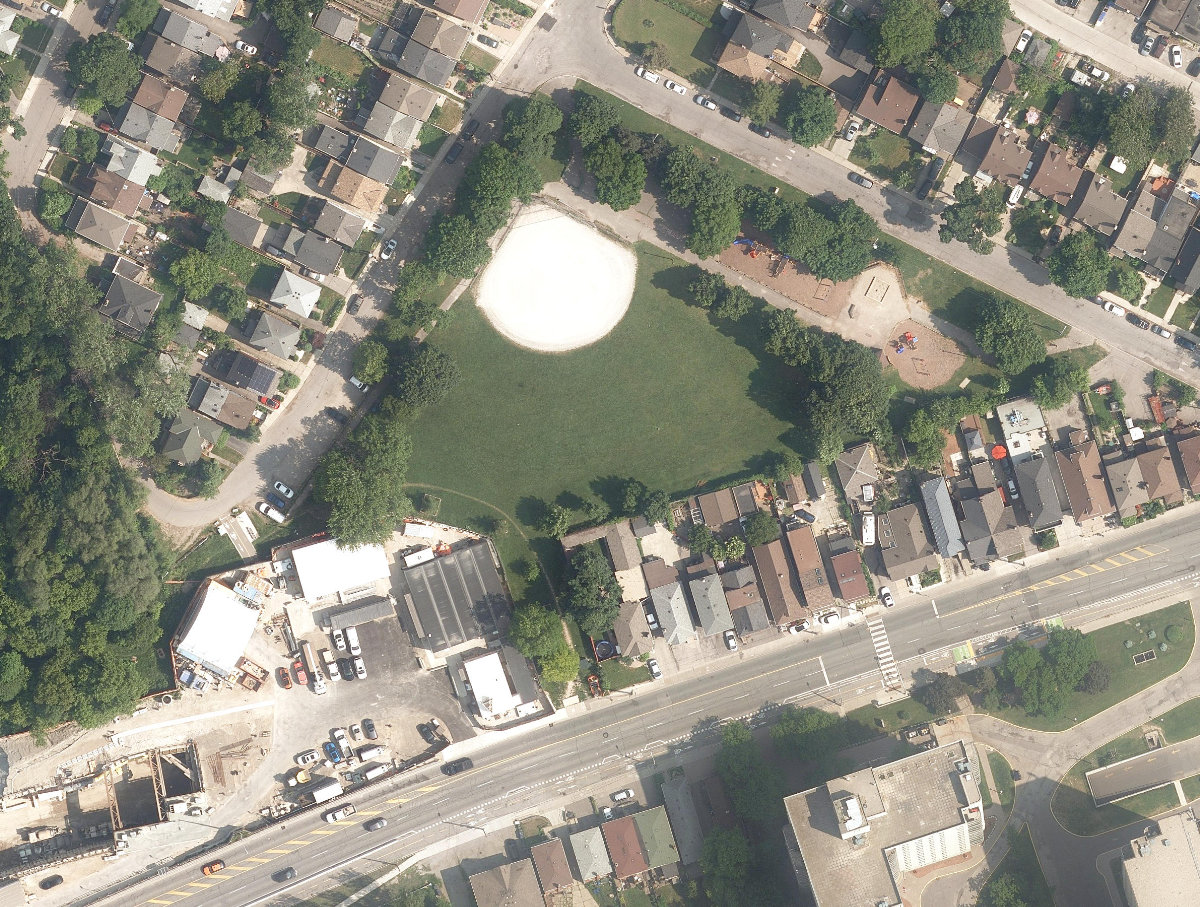
Aerial, City of Toronto orthophoto, ~8 cm/px source · cached 5/9/2026
Pearen Park scores 40.3 / 100. Strongest dimensions: connectivity and enclosure / eyes on park. Weakest: edge activation (20). Border-vacuum risk is elevated (90). This score is a transparent reading of Jane Jacobs-style vitality factors, not a definitive judgment.
Area · 1.28 ha
Weighted across six dimensions · confidence 68%
Scores are not bell-curved. Percentiles and expected scores provide context without changing the underlying model.
Loading map…
The parks map is loading.Explain this score
Where did the 40 come from? Each weighted contribution against a neutral 50 baseline. Green = pushed up; red = pulled down.
Sum of contributions = the headline score. A negative bar means that dimension dragged the park below the city-wide neutral baseline.
Why this park works
Pearen Park works because its amenity diversity score (21) is in the top tier and its connectivity (70) is also top decile.
What limits this park
Pearen Park's edges are fronted by border-vacuum land uses (highways, rail, parking, blank institutional), risk score 90.
Most distinctive characteristic
Most distinctive feature: exceptionally high amenity diversity (21, top decile).
Jacobs reading
Pearen Park sits between an urban social park and an ecological retreat: moderately useful for both, exceptionally suited to neither.
Tradeoffs
- The park is enclosed by buildings (69) but the surrounding streets are quiet (edge activation 20): frame without animation.
- High connectivity coexists with high border-vacuum risk (90): much of that connectivity is to highways, rail, or parking lots, not to neighbourhoods.
Typology classification
Classified as Neighbourhood Park: 1.3 ha, framed by 2 mid-rise vs 2 towers
Edge Activation
Within 100 m of the park edge: 9 active uses (restaurant, retail, cafe, transit_stop) and 5 dead/hostile uses (highway). Active edges keep "eyes on the park" through the day; parking lots, blank institutional walls, rail and highway frontages drain street life.
Source: OSM POIs (amenity/shop) + Toronto Building Footprints + land use
Connectivity
Connectivity blends paths, intersections, transit, entrances, and edge density. This park has 4 mapped paths/walkways and 17 sidewalk segments within 50 m; 11 street intersections within 100 m; 42 transit stops within a 400 m walk; 5 estimated access points across ~580 m of perimeter. edge density is healthy, no superblock penalty. Source coverage: centreline, pedestrian_network, transit_osm.
Source: Toronto Centreline V2 + Pedestrian Network + OSM transit stops
Amenity Diversity
2 distinct amenity types in the park (playground, sports_field). Diversity, not raw count, drives the score so a park with many distinct activity types can outrank a larger park that repeats the same use.
Source: Toronto Parks & Recreation Facilities + OSM amenity tags
Natural Comfort
Natural-comfort components for this park: ~17.0% effective canopy (0.0% from contiguous tree polygons + scattered tree density); 17.6% inside the ravine system; nearest waterbody ~244 m; 31 city-mapped trees inside the polygon (24.3/ha). Reading: exposed. Source coverage: ravine, waterbodies, street_trees. Impervious surface is approximated (Toronto's authoritative layer ships only as a raster GeoTIFF).
Source: Toronto Treed Area + Ravine + Waterbodies + Street Tree Inventory
Enclosure / Eyes on Park
94 buildings within 25 m of the park edge (2 mid-rise, 90 low-rise, 2 tower); avg edge height 7.0 m (~2 floors); 16.2 buildings per 100 m of 580 m perimeter (strong frontage density); edges are low-rise (mostly 2 to 3 floors); 2 towers ≥ 40 m within 25 m of the edge. "Eyes on the park" come strongest from the 2 mid-rise edge buildings.
Source: Toronto 3D Massing (building footprints + heights)
Border Vacuum Risk
Border-vacuum factors within 50 m of the park: Eglinton Avenue West, Eglinton Avenue West, Eglinton Avenue West. Jacobs warned that highways, rail, parking lots and blank institutional edges act as "vacuums" that suppress foot traffic and isolate the park from its neighbourhood.
Source: Toronto Street Centreline (highways) + rail layer + OSM landuse + building footprints
Equity Context
Equity Context requires inputs not yet loaded for this park (Toronto Neighbourhood Profiles). Score is held at a neutral 50 with low confidence. Read with caution.
Source: Toronto Neighbourhood Profiles
Amenities (2 types · 2 records)
- playground
- sports field
Nearby active-edge features (58)
- highway: Eglinton Avenue West32 m
- transit stop: 3574 Eglinton Avenue West36 m
- highway: Eglinton Avenue West44 m
- highway: Eglinton Avenue West44 m
- transit stop: Opposite 3574 Eglinton Avenue West51 m
- highway: Eglinton Avenue West56 m
- highway: Eglinton Avenue West85 m
- retail: Erica Fresh Meat African Market & Beauty Supply93 m
- restaurant: York Burger94 m
- restaurant: Domino's95 m
- retail: Da Vince Nails Spa96 m
- retail97 m
- retail: Print Three97 m
- cafe: Bap Bubble Tea98 m
- transit stop: Weston Rd at Oxford Dr101 m
- retail: M&M Variety & Grocery101 m
- retail: Inkredible Tattoos101 m
- restaurant: Calabar Grill104 m
- retail: Nate Beauty & Co.107 m
- highway: Eglinton Avenue West115 m
- transit stop: Oxford Drive117 m
- retail: A&M Lifestyle Variety117 m
- retail: CPV Unisex Tailoring117 m
- retail: Lounge118 m
- retail: Digicel118 m
- retail: Carolina Beauty Center118 m
- retail: Joe's Clip Away119 m
- restaurant: Weston Pizza & Wings119 m
- restaurant: V's Caribbean Restaurant120 m
- restaurant: Alis Shawarma121 m
- retail: Express Wash Laundromat121 m
- restaurant: 20 Doner Bar-Grill122 m
- retail: Henry Convenience122 m
- retail: Go Tec123 m
- retail: The Pot Spot123 m
- retail: My Mama's Closet123 m
- retail: The New Millenium124 m
- highway: Eglinton Avenue West125 m
- restaurant: Meechies BBQ & Jerk126 m
- retail126 m
- retail: Ali Barber Salon129 m
- restaurant: 244 Pizza & Wings133 m
- retail: Tennis Club134 m
- retail: Abeni African Food Inc.135 m
- parking lot135 m
- restaurant: K&A Caribbean Restaurant139 m
- restaurant: First Class Delites149 m
- transit stop: Weston Rd at Eglinton Ave W153 m
- highway: Eglinton Avenue West155 m
- transit stop: Ray Avenue158 m
- parking lot160 m
- highway: Eglinton Avenue West161 m
- transit stop: Weston Road165 m
- transit stop: Weston Rd at Ray Ave169 m
- parking lot175 m
- highway: Eglinton Avenue West181 m
- parking lot189 m
- cafe: Supercoffee195 m
Park profile
Five-axis radar across the structural dimensions.
Citywide percentile ranks
Across all Toronto parks in the dataset.
- Overall vitality77th
- Edge activation78th
- Connectivity90th
- Amenity diversity91th
- Natural comfort76th
- Enclosure68th
Most similar parks
Closest in metric space across the five structural dimensions.
- Humbertown ParkParkette46
- Westlake ParkRavine / Naturalized Park51
- Trethewey Park WestAthletic / Recreation Park51
- Fairfield ParkNeighbourhood Park45
- Stonehouse ParkNeighbourhood Park47
Most opposite parks
Furthest in metric space. Useful for recognising what kind of park this isn’t.
- Rouge ParkRavine / Naturalized Park18
- Toronto Islands - Muggs Island ParkRavine / Naturalized Park25
- Rouge ParkRavine / Naturalized Park21
- Trca Lands ( 58)Waterfront Park18
- Trca Lands ( 26)Ravine / Naturalized Park27
Human activity signals: not available
No activity signals have landed for this park yet. The model has scored its physical form but it can’t yet say how often it’s programmed, photographed, or walked through. See /data-ethics for what we will and will not collect.
Does this score feel accurate?
Your read of Pearen Parkmatters. We’re testing whether the model lines up with how people actually use the park. Submissions are stored locally; no account needed.
Tell us how this park feels
We measure structure (canopy, edges, connectivity). You measure feeling. Both matter, and disagreement is itself useful civic data.
What would improve this park?
Generated from the weakest measured dimensions: a starting point, not a prescription.
- Activate the edges: encourage cafés, retail or community uses on the streets that face the park; replace blank or parking-lot edges where possible.
- Diversify what people can do in the park (playground, washroom, water, shade, performance, sport, garden): even small additions raise this score.
- Mitigate border vacuums (highways, rail, parking) with active programming on the still-permeable edges and treat the hostile edge as a design challenge.
Data sources
- City of Toronto Open Data: Parks (Green Space)Polygon boundaries, official names, types.
- Parks & Recreation FacilitiesInventory of in-park amenities (washrooms, fields, rinks…).
- Toronto Pedestrian NetworkSidewalk segments around and through parks; estimated park entrances.
- Toronto Centreline V2Street segments + intersection nodes near park edges; trails and walkways.
- Toronto 3D MassingBuilding footprints + heights for edge-building counts, frontage density, and tower-in-the-park risk.
- Toronto Treed AreaTree canopy share inside park polygons via stratified-grid sampling.
- Toronto Waterbodies & RiversWater surface inside parks + nearest-water distance for cooling.
- Ravine & Natural Feature ProtectionRavine overlap as a cooling / natural-comfort signal.
- Toronto Street Tree InventoryTree count + density inside park polygons.
- Neighbourhood Profiles(Pending) Equity context proxy.
- OpenStreetMap (Overpass API)Cafés, restaurants, retail, transit stops, parking, highways, rail.