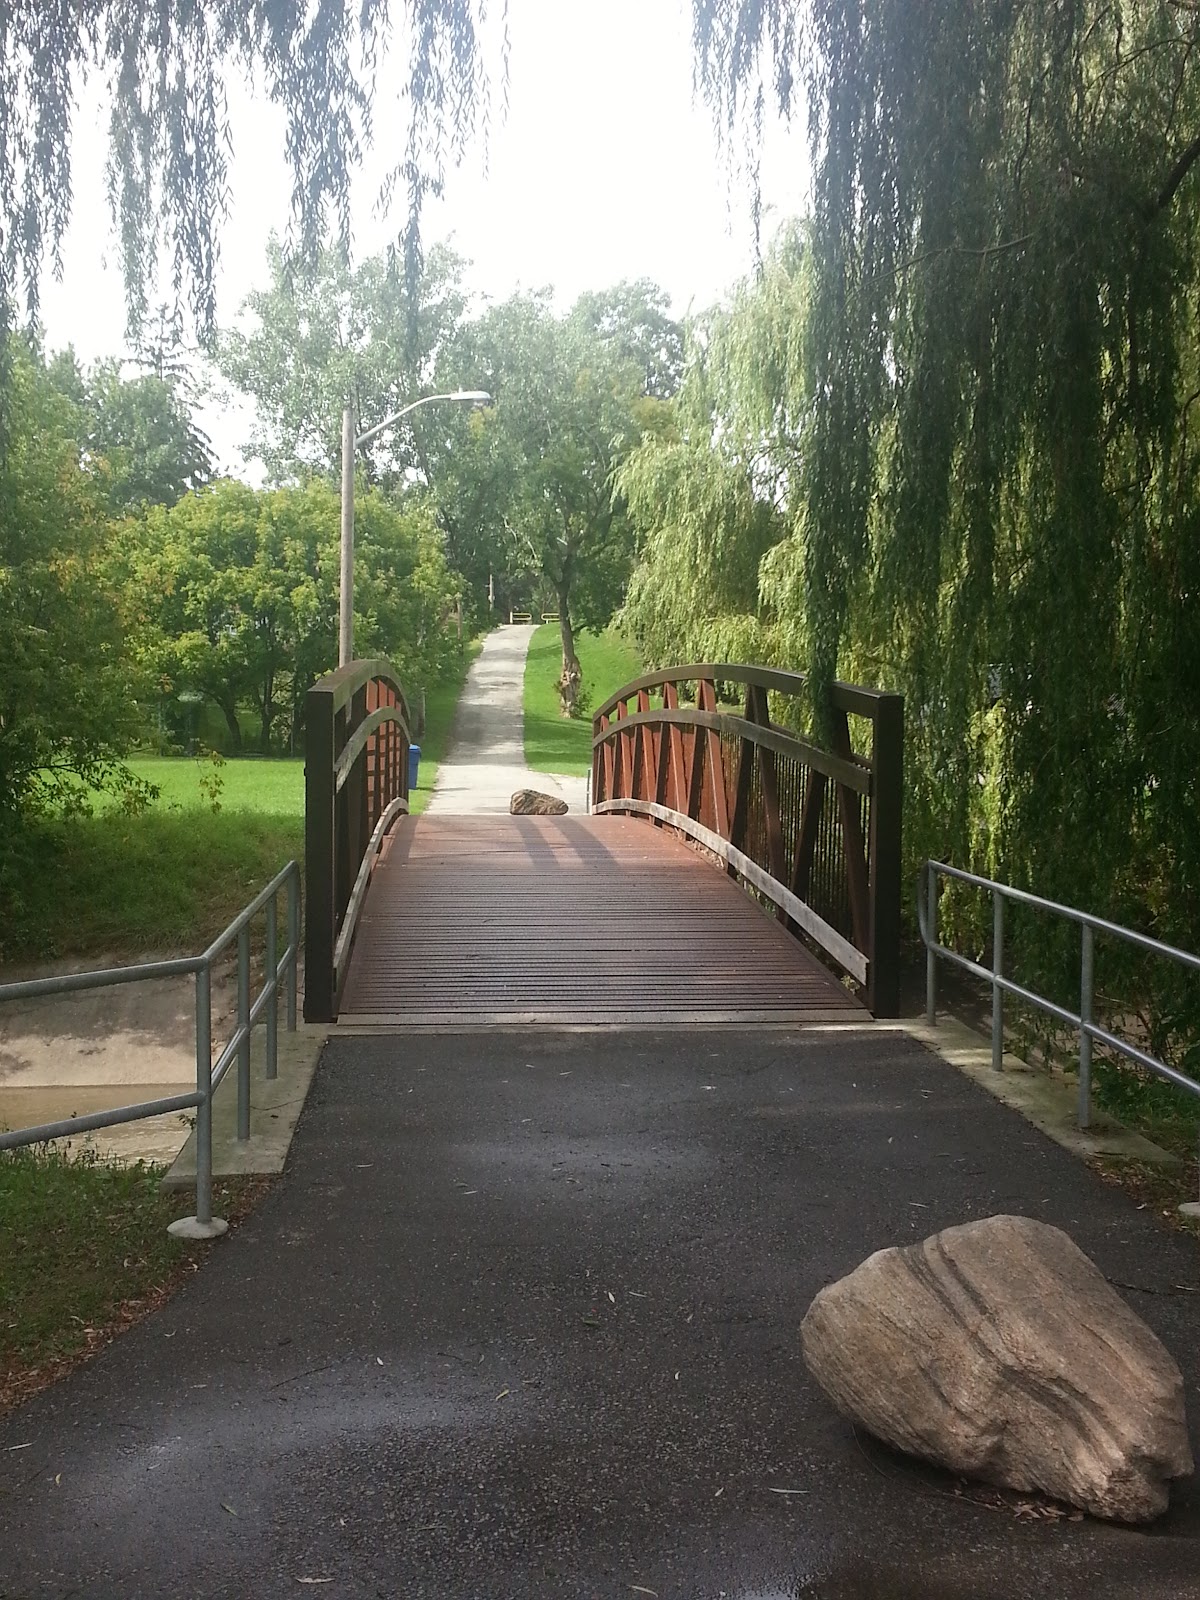
Smythe Park
Waterfront Park, in the top tier overall (score 44, rank ~88th percentile). Strongest: amenity diversity; weakest: enclosure.
Photo by Willie B. Hardigan via Google Places · cached 5/9/2026
Smythe Park scores 44.2 / 100. Strongest dimensions: connectivity and enclosure / eyes on park. Weakest: edge activation (4). Border-vacuum risk is elevated (36). This score is a transparent reading of Jane Jacobs-style vitality factors, not a definitive judgment.
Area · 15.31 ha
Weighted across six dimensions · confidence 72%
Scores are not bell-curved. Percentiles and expected scores provide context without changing the underlying model.
Loading map…
The parks map is loading.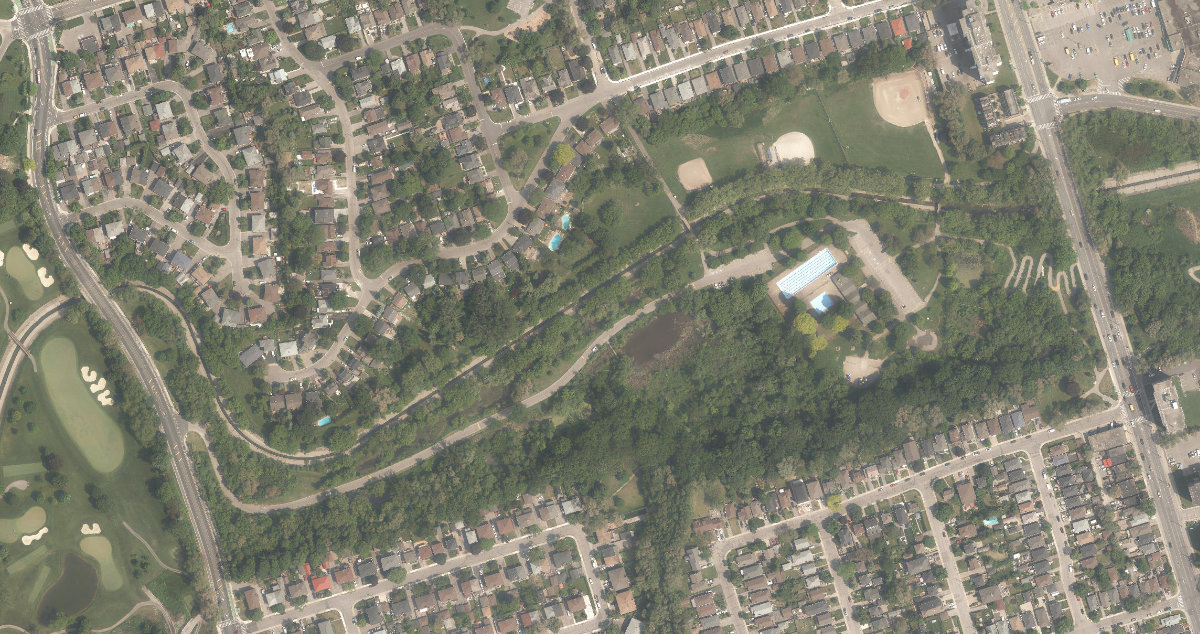
Explain this score
Where did the 44 come from? Each weighted contribution against a neutral 50 baseline. Green = pushed up; red = pulled down.
Sum of contributions = the headline score. A negative bar means that dimension dragged the park below the city-wide neutral baseline.
Why this park works
Smythe Park works because its amenity diversity score (35) is one of the city's strongest and its connectivity (75) is also top decile.
What limits this park
Smythe Park's edges are fronted by border-vacuum land uses (highways, rail, parking, blank institutional), risk score 36.
Most distinctive characteristic
Most distinctive feature: exceptionally high amenity diversity (35, top decile).
Jacobs reading
Smythe Park sits between an urban social park and an ecological retreat: moderately useful for both, exceptionally suited to neither.
Tradeoffs
- The park is enclosed by buildings (66) but the surrounding streets are quiet (edge activation 4): frame without animation.
Performance in context
- A modest overperformer for its waterfront park typology (+7 vs the median in large Waterfront Park waterfront).
Typology classification
Classified as Waterfront Park: 8% water surface inside park. Secondary read: Ravine / Naturalized Park (100% ravine overlap, 8% canopy).
Edge Activation
Within 100 m of the park edge: 9 active uses (transit_stop, retail) and 7 dead/hostile uses (parking_lot). Active edges keep "eyes on the park" through the day; parking lots, blank institutional walls, rail and highway frontages drain street life.
Source: OSM POIs (amenity/shop) + Toronto Building Footprints + land use
Connectivity
Connectivity blends paths, intersections, transit, entrances, and edge density. This park has 38 mapped paths/walkways and 76 sidewalk segments within 50 m; 28 street intersections within 100 m; 21 transit stops within a 400 m walk; 9 estimated access points across ~2,493 m of perimeter. low edge density, significant superblock penalty applied. Source coverage: centreline, pedestrian_network, transit_osm.
Source: Toronto Centreline V2 + Pedestrian Network + OSM transit stops
Amenity Diversity
4 distinct amenity types in the park (picnic, playground, sports_field, washroom). Diversity, not raw count, drives the score so a park with many distinct activity types can outrank a larger park that repeats the same use.
Source: Toronto Parks & Recreation Facilities + OSM amenity tags
Natural Comfort
Natural-comfort components for this park: 8.1% estimated tree canopy; 100.0% inside the ravine system; 8.1% water surface; 171 city-mapped trees inside the polygon (11.2/ha). Reading: ravine-cooled. Source coverage: treed_area, ravine, waterbodies, street_trees. Impervious surface is approximated (Toronto's authoritative layer ships only as a raster GeoTIFF).
Source: Toronto Treed Area + Ravine + Waterbodies + Street Tree Inventory
Enclosure / Eyes on Park
242 buildings within 25 m of the park edge (13 mid-rise, 226 low-rise, 3 tower); avg edge height 6.0 m (~2 floors); 9.7 buildings per 100 m of 2,493 m perimeter (strong frontage density); edges are low-rise (mostly 2 to 3 floors); 3 towers ≥ 40 m within 25 m of the edge. "Eyes on the park" come strongest from the 13 mid-rise edge buildings.
Source: Toronto 3D Massing (building footprints + heights)
Border Vacuum Risk
Border-vacuum factors within 50 m of the park: parking_lot, parking_lot, parking_lot. Jacobs warned that highways, rail, parking lots and blank institutional edges act as "vacuums" that suppress foot traffic and isolate the park from its neighbourhood.
Source: Toronto Street Centreline (highways) + rail layer + OSM landuse + building footprints
Equity Context
Equity Context requires inputs not yet loaded for this park (Toronto Neighbourhood Profiles). Score is held at a neutral 50 with low confidence. Read with caution.
Source: Toronto Neighbourhood Profiles
Amenities (4 types · 4 records)
- picnic
- playground
- sports field
- washroom
Nearby active-edge features (50)
- parking lot0 m
- parking lot0 m
- parking lot14 m
- transit stop: Edinborough Court22 m
- transit stop: Haney Avenue31 m
- transit stop: Alliance Avenue56 m
- parking lot56 m
- transit stop: Jane Street59 m
- transit stop60 m
- retail: Habesha Variety63 m
- transit stop: Scarlett Rd at Edinborough Court64 m
- transit stop: Haney Avenue67 m
- transit stop: Jane St at Alliance Ave68 m
- parking lot76 m
- parking lot77 m
- parking lot100 m
- parking lot108 m
- parking lot109 m
- parking lot125 m
- parking lot130 m
- restaurant: 33 Beefsteak Tantuni Grill Lounge130 m
- restaurant: Royal Noodle Restaurant132 m
- retail: David’s Barber Shop133 m
- retail: Gill’s Convenience Store136 m
- retail: Value Mobile136 m
- restaurant: Church's Chicken138 m
- parking lot139 m
- restaurant: Mr. Sub141 m
- restaurant: Island Breeze Restaurant141 m
- restaurant: Subway144 m
- restaurant: Pizza Pizza145 m
- retail: Jane Park Super Coin Laundry145 m
- retail: Best Travel & Tours148 m
- retail: ABC Dollar149 m
- retail: Psychic & Fortune Teller151 m
- retail: Aroma Massage153 m
- retail: Best Beauty Supply155 m
- retail: Kenneth's Variety160 m
- retail: Food Basics163 m
- retail: The Great Apparel Co.163 m
- retail: Nail Gallery166 m
- retail: Hear Max Hearing Clinic167 m
- parking lot174 m
- retail: Money Stop182 m
- parking lot185 m
- retail: Mulu Home Accessory Shop187 m
- transit stop: East Drive189 m
- retail: Men’s Cut ‘N’ Style Barber Shop191 m
- retail: Shisha Zone193 m
- parking lot199 m
Park profile
Five-axis radar across the structural dimensions.
Citywide percentile ranks
Across all Toronto parks in the dataset.
- Overall vitality88th
- Edge activation65th
- Connectivity95th
- Amenity diversity98th
- Natural comfort69th
- Enclosure62th
Most similar parks
Closest in metric space across the five structural dimensions.
- Coronation Park - YorkRavine / Naturalized Park38
- Ancaster ParkAthletic / Recreation Park42
- Goldhawk ParkCorridor / Linear Park37
- Fairbank Memorial ParkCivic Square44
- Eglinton FlatsWaterfront Park35
Most opposite parks
Furthest in metric space. Useful for recognising what kind of park this isn’t.
- Joseph Burr Tyrrell ParkUrban Plaza50
- Simcoe ParkTower-Community Green Space51
- Queen'S Quay Traffic IslandWaterfront Park49
- Bernard Avenue Road AllowanceUrban Plaza54
- Toronto Islands - Muggs Island ParkRavine / Naturalized Park25
Human activity signals: not available
No activity signals have landed for this park yet. The model has scored its physical form but it can’t yet say how often it’s programmed, photographed, or walked through. See /data-ethics for what we will and will not collect.
Does this score feel accurate?
Your read of Smythe Parkmatters. We’re testing whether the model lines up with how people actually use the park. Submissions are stored locally; no account needed.
Tell us how this park feels
We measure structure (canopy, edges, connectivity). You measure feeling. Both matter, and disagreement is itself useful civic data.
What would improve this park?
Generated from the weakest measured dimensions: a starting point, not a prescription.
- Activate the edges: encourage cafés, retail or community uses on the streets that face the park; replace blank or parking-lot edges where possible.
- Diversify what people can do in the park (playground, washroom, water, shade, performance, sport, garden): even small additions raise this score.
- Mitigate border vacuums (highways, rail, parking) with active programming on the still-permeable edges and treat the hostile edge as a design challenge.
Data sources
- City of Toronto Open Data: Parks (Green Space)Polygon boundaries, official names, types.
- Parks & Recreation FacilitiesInventory of in-park amenities (washrooms, fields, rinks…).
- Toronto Pedestrian NetworkSidewalk segments around and through parks; estimated park entrances.
- Toronto Centreline V2Street segments + intersection nodes near park edges; trails and walkways.
- Toronto 3D MassingBuilding footprints + heights for edge-building counts, frontage density, and tower-in-the-park risk.
- Toronto Treed AreaTree canopy share inside park polygons via stratified-grid sampling.
- Toronto Waterbodies & RiversWater surface inside parks + nearest-water distance for cooling.
- Ravine & Natural Feature ProtectionRavine overlap as a cooling / natural-comfort signal.
- Toronto Street Tree InventoryTree count + density inside park polygons.
- Neighbourhood Profiles(Pending) Equity context proxy.
- OpenStreetMap (Overpass API)Cafés, restaurants, retail, transit stops, parking, highways, rail.